8.6 Inventory Models for Certain Demand: Economic Production Quantity (EPQ)
The Economic Production Quantity (EPQ) model is applicable when an organization has its own internal production capabilities rather than ordering from an external supplier. Unlike the Economic Order Quantity (EOQ) model, where inventory is received in a single batch, the EPQ model accounts for a gradual replenishment of inventory through production.
Key Differences from EOQ
- Production Setup Cost: In the EPQ model, there is a production setup cost associated with preparing the machines or production area before commencing each production run or cycle.
- Gradual Inventory Replenishment: Instead of receiving the entire order quantity (Q) at once, as in the EOQ model, the inventory level increases gradually during the production uptime or run time.
Inventory Level Behaviour
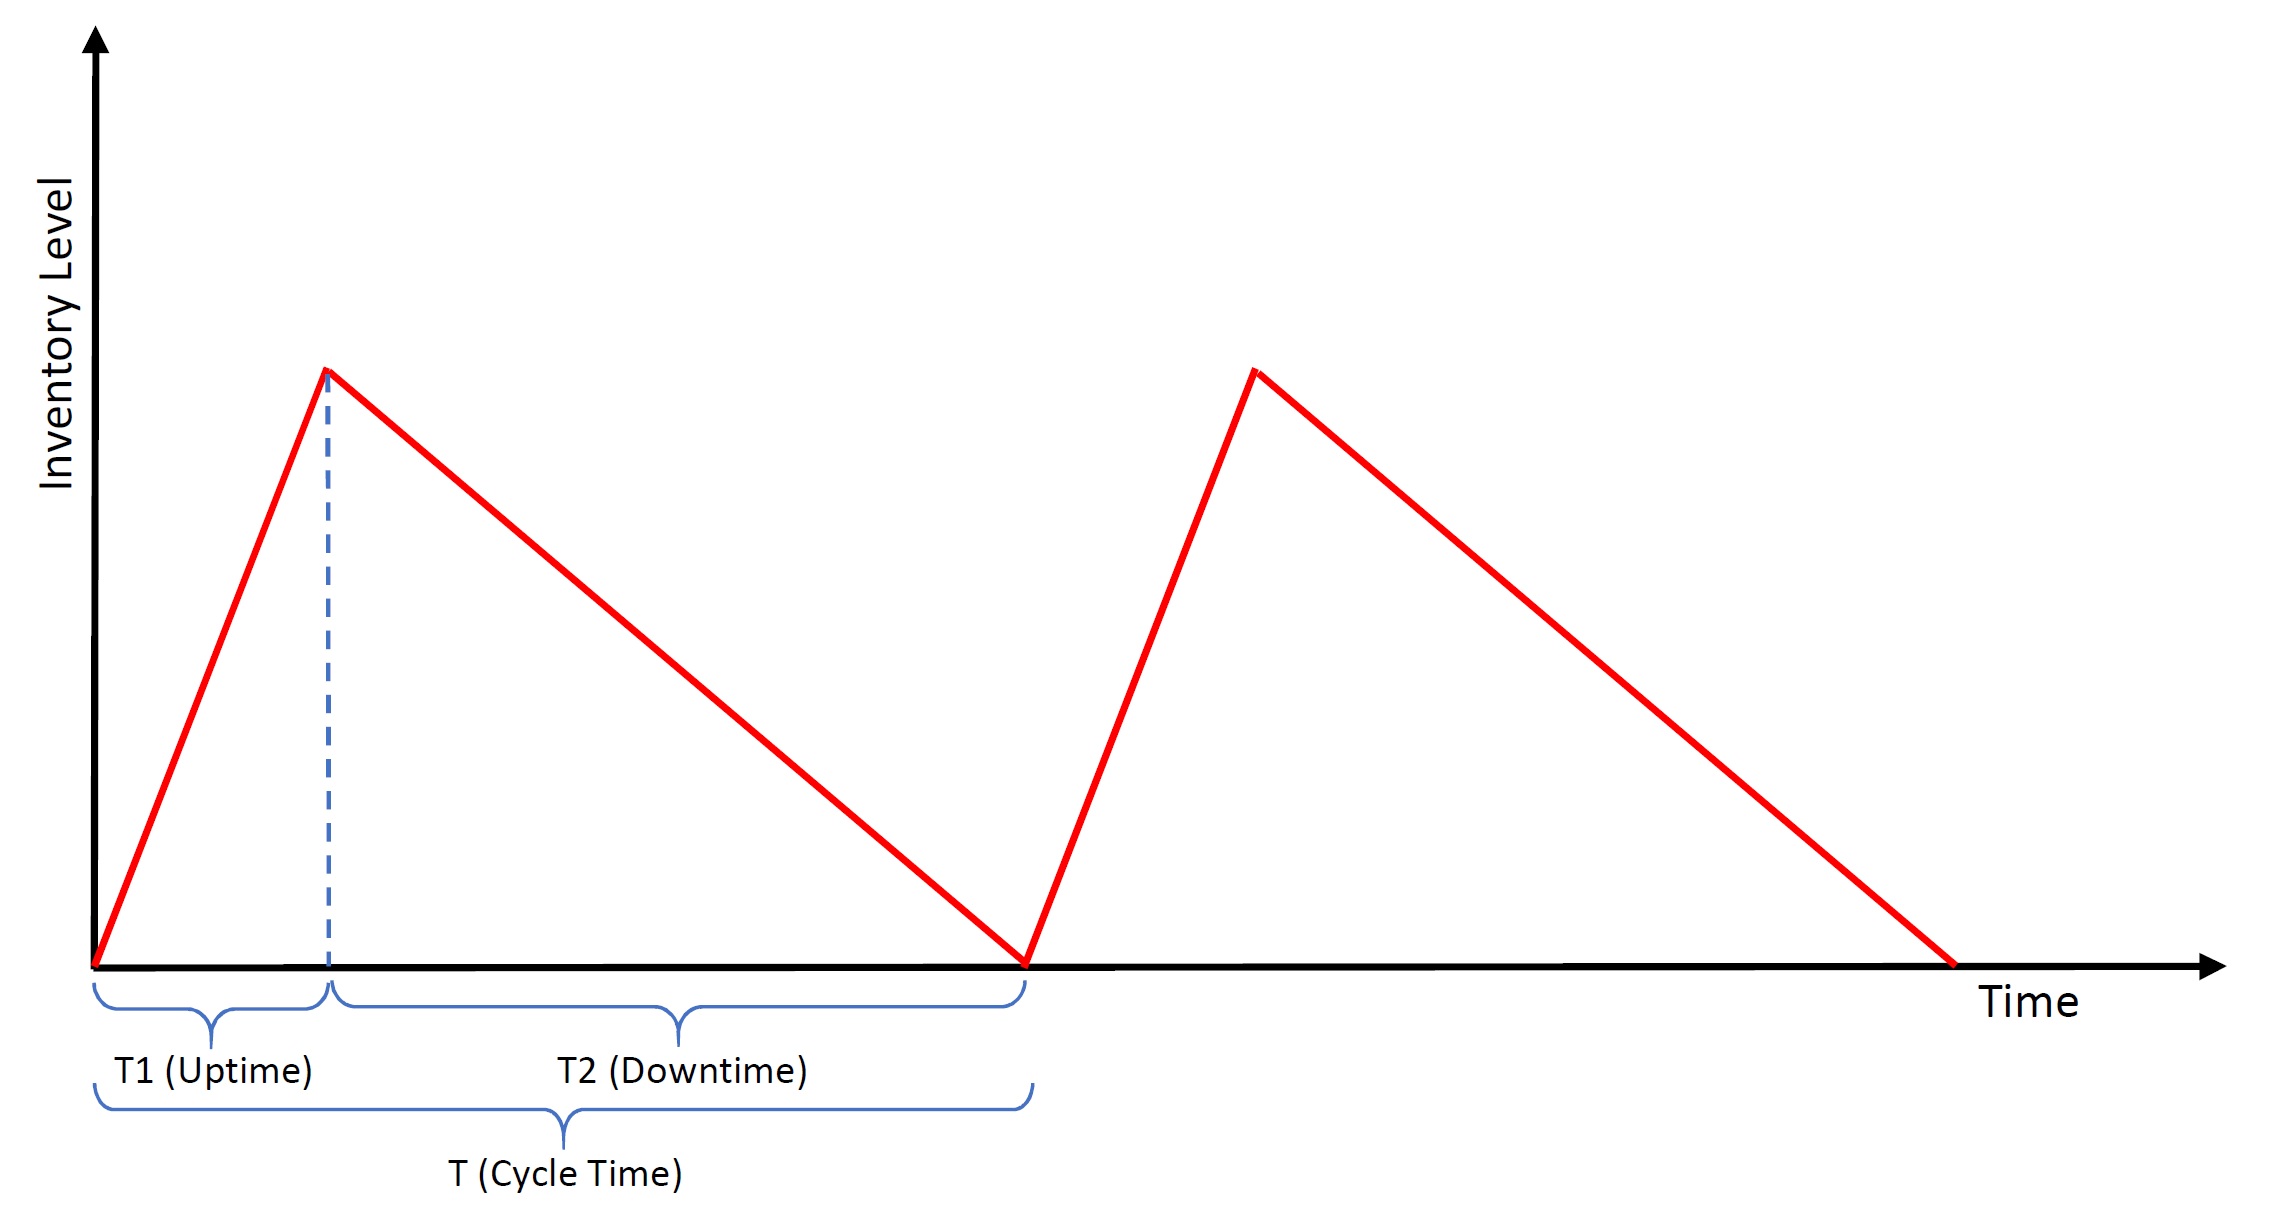
The inventory level fluctuates in a distinct pattern under the EPQ model, as illustrated in the following diagram

The red line in the diagram represents the fluctuating inventory level over time. During the uptime or run time (T1), production is ongoing at a rate of p units per day, while customer demand is occurring simultaneously at a rate of d units per day. Consequently, the inventory level increases at a rate of (p − d) units per day, reflecting the net accumulation of inventory.
Production continues until the inventory level reaches a predetermined maximum level. At this point, production is halted, and the accumulated inventory is utilized solely to satisfy customer demand during the downtime period (T2). During the downtime, the inventory level gradually decreases as the piled-up stock is depleted to meet demand.
A fundamental assumption of the EPQ model is that the production rate (p) exceeds the demand rate (d). If this assumption is violated, and the demand rate surpasses the production rate, the organization will inevitably face stock-outs, as the production capacity would be insufficient to replenish the inventory at the required rate.
By adhering to the condition of p > d, the EPQ model ensures that the production process can consistently replenish inventory levels, enabling the organization to meet customer demand without experiencing stock-outs during the downtime period. This assumption is crucial for maintaining a stable inventory management system and ensuring uninterrupted operations.
In terms of calculations, if we use the following notation and replace the H (i.e., the holding cost per unit of item per year) by it, we can use the same formulations from the EOQ model for the optimal lot size (run size) and the total cost. Here are the calculations:
Note that “D” is defined as the demand per year, while “d” is the demand per day. In addition, Q* is a specific value for Q, which is associated with the optimal quantity. If we need to find the optimal total cost, we will need to use the value of Q* as the Q in the formula for TC(Q). Let’s have a look at an example.
Example
An automotive manufacturer uses 48,000 M1 gearboxes per year for its X1 SUV series. The firm makes its own M1 gearboxes, which it can produce at a rate of 800 per day. The carrying cost is $1 per gearbox per year. Setup cost for a production run of M1 gearboxes is $45. The firm operates 240 days per year. Determine:
- The optimal run size
- The minimum total annual cost for carrying and setup
- Cycle time for the optimal run size
- The production run time (uptime)
- Maximum inventory
Solution
Demand per year = D = 48000
Production rate per day = p = 800
Demand rate per day = d = 48000 ÷ 240 = 200
Ordering cost per unit = S = $45
Unit inventory holding cost = H = $1
a. The optimal run size
b. The minimum total annual cost for carrying and setup
c. Cycle time for the optimal run size
d. The production run time (uptime)
e. Maximum inventory
“Inventory Management” from Introduction to Operations Management Copyright © by Hamid Faramarzi and Mary Drane is licensed under a Creative Commons Attribution-NonCommercial-ShareAlike 4.0 International License, except where otherwise noted.—Modifications: used section Inventory Models for Certain Demand: Economic Production Quantity (EPQ), some paragraphs rewritten; added additional explanations.

