
Chapter 4. Food and Beverage Services
4.2 Types of Food and Beverage Providers
While there are many ways to analyze the sector, in this chapter we take a market-based, business-operation approach based on the overall Canadian market share from the Restaurants Canada Market Review and Forecast (Restaurants Canada, 2019). The following sections explore the types of food service operations in Canada.
There are two key distinctions: commercial foodservice, which comprises operations whose primary business is food and beverage, and non-commercial foodservice establishments where food and beverages are served but are not the primary business.
Let’s start with the largest segment of F&B operations, the commercial sector.
Commercial Operators
Commercial operators make up the largest segment of F&B in Canada with just over 80% market share (Restaurants Canada, 2019). It is made up of quick-service restaurants, full-service restaurants, catering, and drinking establishments. Let’s look at each of these in more detail.
Quick-Service Restaurants
Formerly known as fast-food restaurants, quick-service restaurants, or QSRs, makeup 44.4% of total food sales in Canada (Restaurants Canada, 2019). This prominent portion of the food sector generally caters to both residents and visitors and is represented in areas that are conveniently accessed by both. Brands, chains, and franchises dominate the QSR landscape. While the sector has made steps to move away from the traditional fast-food image and style of service, it is still dominated by both fast food and food fast; in other words, food that is prepared and purchased quickly, and generally consumed quickly.
Take a Closer Look: The First McDonald’s In Canada
The first McDonald’s restaurant in Canada opened in Richmond, BC, in 1967. Located on No. 3 Road, it featured a sleek almost space-age design. To see a picture of the location, visit McDonald’s: Then and Now.
Convenience and familiarity are key in this sector. Examples of QSRs include:
- Drive-through locations
- Stand-alone locations
- Locations within retail stores
- Kiosk locations in shopping centres
- High-traffic areas, such as major highways or commuter routes
Full-Service Restaurants
With 44.2% of the market share (Restaurants Canada, 2019), full-service restaurants are perhaps the most fluid of the F&B operation types, adjusting and changing to the demands of the marketplace. Consumer expectations are higher here than with QSRs (Parsa, Lord, Putrevu, & Kreeger, 2015). The menus offered are varied, but in general, reflect the image of the restaurant or consumer’s desired experience. Major segments include fine dining, family/casual, ethnic, and upscale casual.
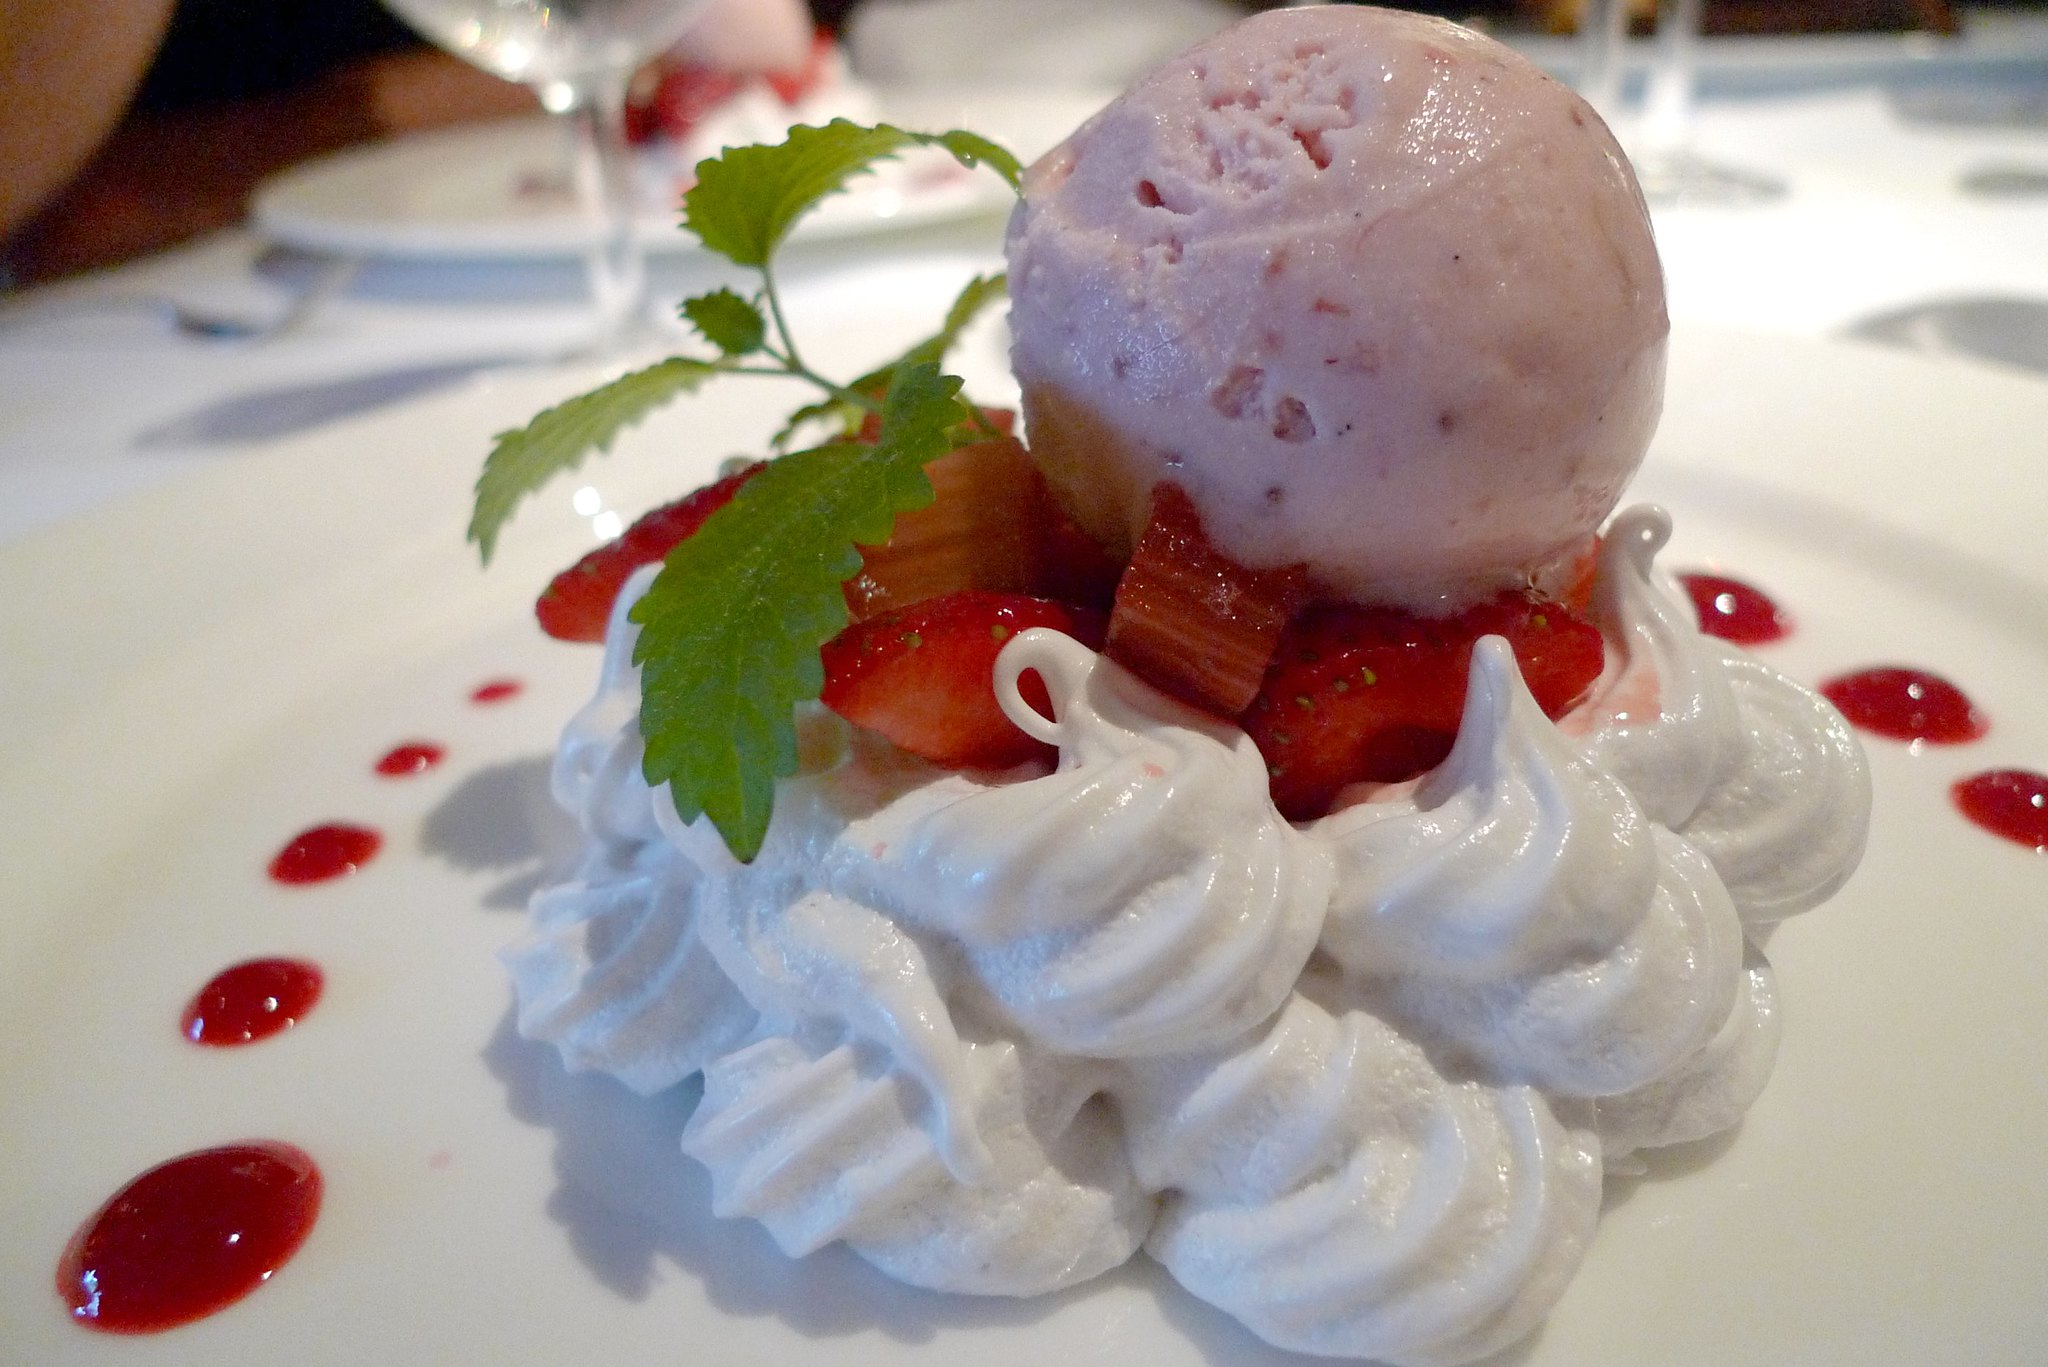
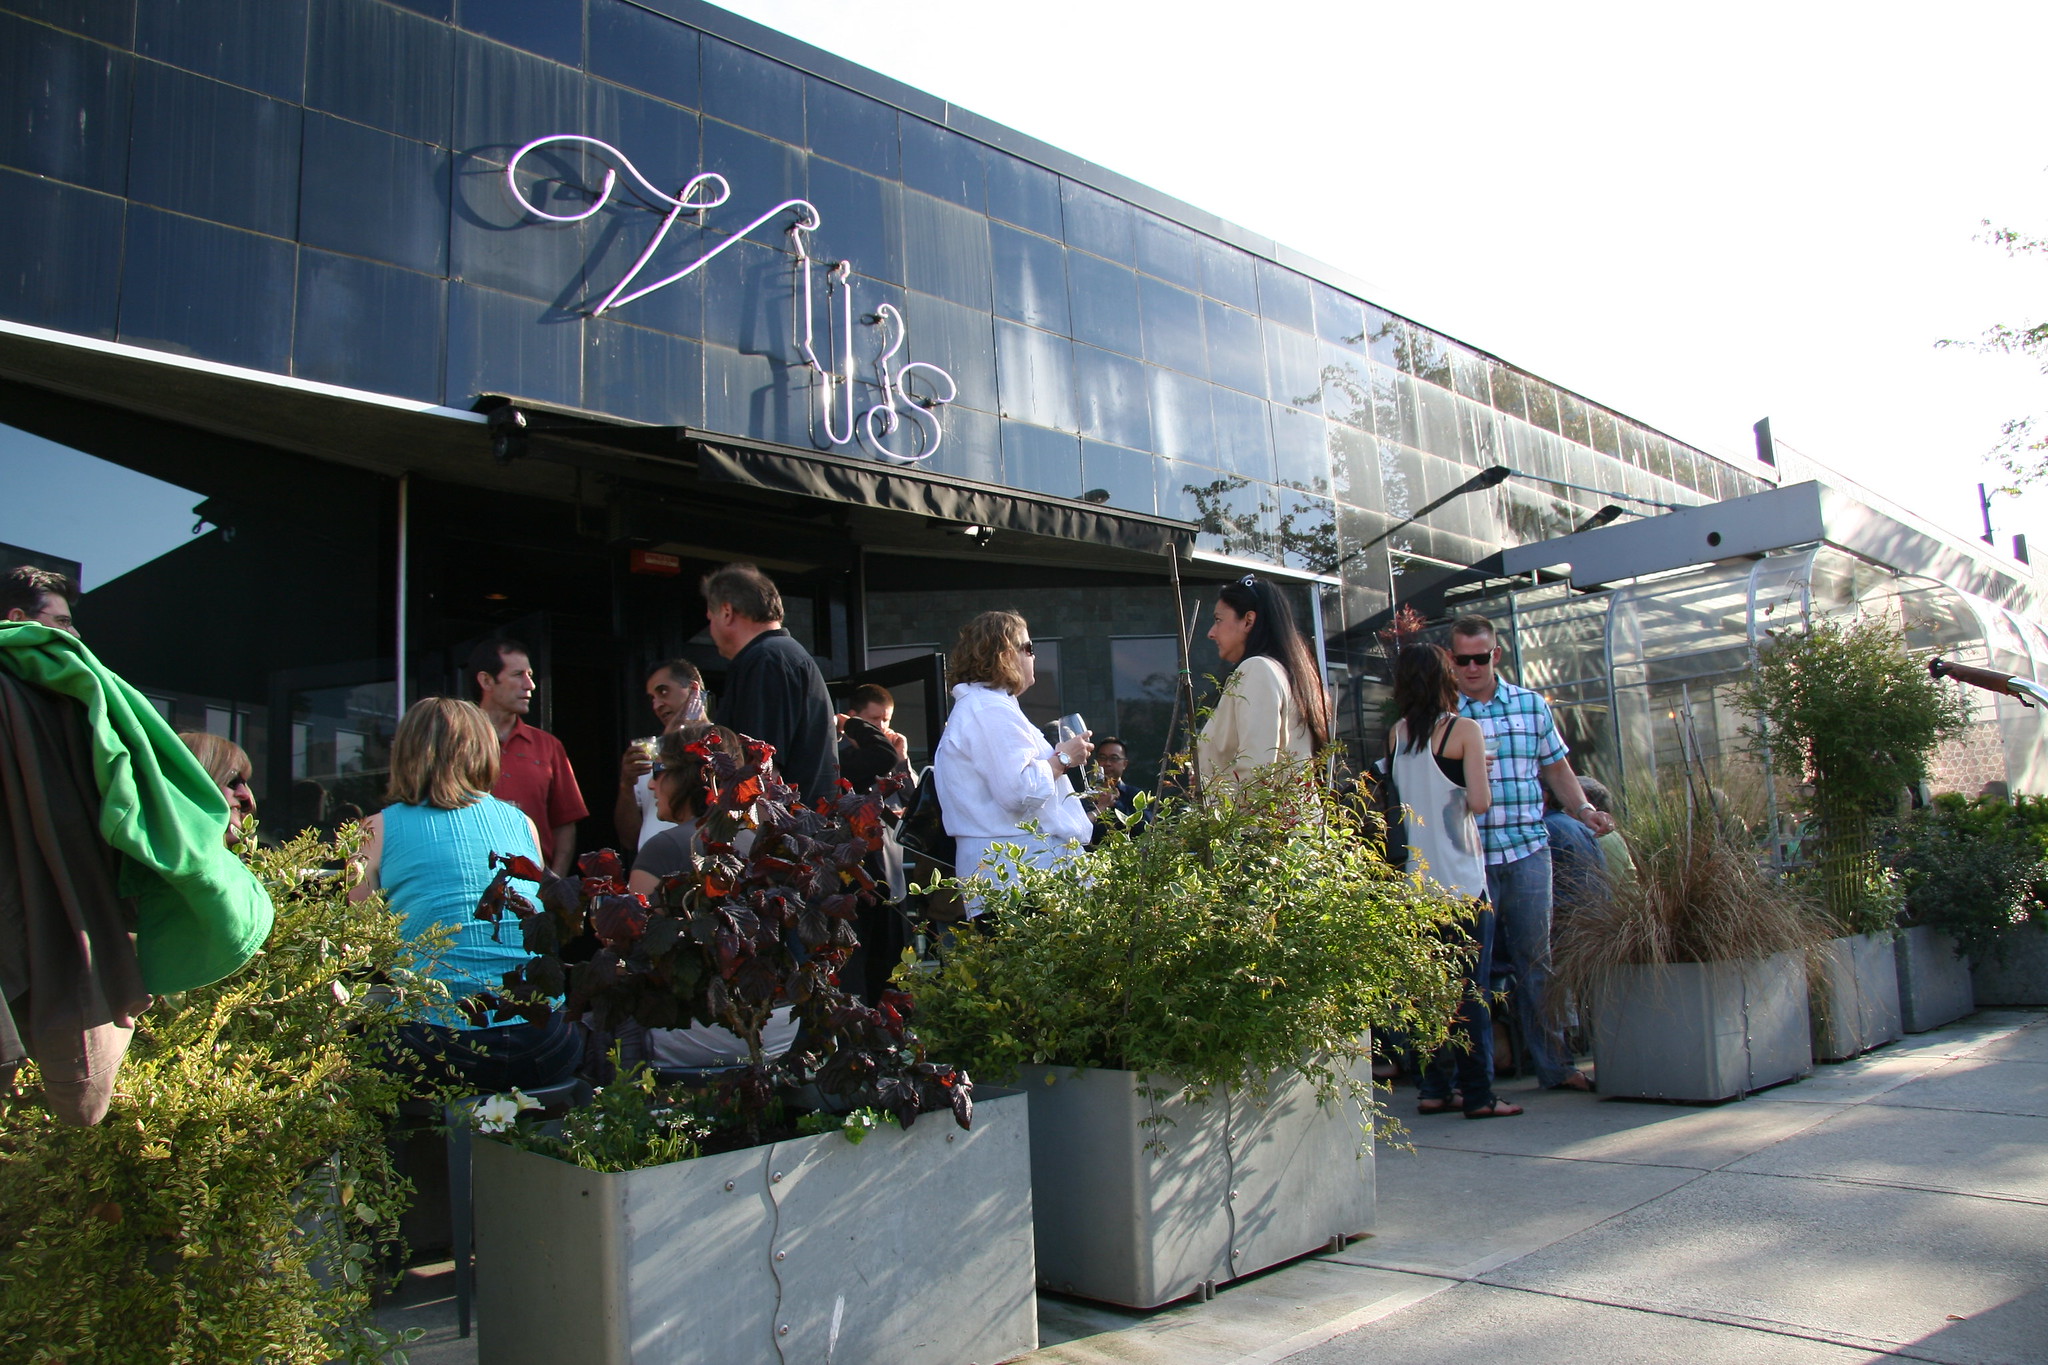
Fine dining restaurants are characterized by highly trained chefs preparing complex food items, exquisitely presented. Meals are brought to the table by experienced servers with sound food and beverage knowledge in an upscale atmosphere. The concept of fine dining has evolved over the years. It was once mandatory to have table linens, fine china, crystal stemware, and silver-plate cutlery in order to be referred to as a fine dining establishment. Service was often very formal and reserved with minimal personal interaction between guests and servers. The table was often embellished with fresh flowers and candles as well. Today the best restaurants focus on the quality of preparation, presentation, and flavor of the food utilizing the best and where possible local ingredients. Servers who are engaged, customer-centric, and well informed are sought after by the best restaurants.
In Canada, many of the finest restaurants feature wine lists heavily showcasing local food and wine. Tablescapes are kept simple, with excellent quality flatware and stemware and minimal fuss with centerpieces and generally no linen tablecloths.
In these businesses, the average cheque, which is the total sales divided by the number of guests served, is quite high (often reviewed with the cost symbols of three or four dollar signs- $ $ $ or $ $ $ $).
Family/casual restaurants are characterized by being open for all three meal periods. These operations offer affordable menu items that span a variety of customer tastes. They also have the operational flexibility in menu and restaurant layout to welcome large groups of diners. An analysis of menus in family/casual restaurants reveals a high degree of operational techniques such as menu item cross-utilization, where a few key ingredients are repurposed in several ways. Service is often very casual and friendly. Both chain and independent restaurant operators flourish in this sector. Popular chain examples include Boston Pizza, East Side Mario’s and Moxie’s Bar and Grill.
Ethnic restaurants typically reflect the owner’s cultural identity. The growth and changing nature of this sector reflect the acceptance of various ethnic foods within our communities. Ethnic restaurants generally evolve along two routes: toward remaining authentic to the cuisine of the country of origin, or toward larger market acceptance through modifying menu items (Mak, Lumbers, Eves, & Chang, 2012). Food is often the medium for this sense of belonging (Koc & Welsh, 2001; Laroche, Kim, Tomiuk, & Belisle, 2005). The authenticity of the experience often drives the customer’s decision. The driving force behind these operations is the Chef’s background, their commitment to the quality of the product, innovative preparation mixed with exceptional technique, and knowledgeable service staff to bring it to the consumer.
Spot Light: Restaurants Canada
Originally created in the 1940’s and at the time called the Canadian Restaurant Association, Restaurants Canada serves as the voice for this industry. They have an amazing magazine called Menu which is full of relevant industry articles. Take some time and explore!
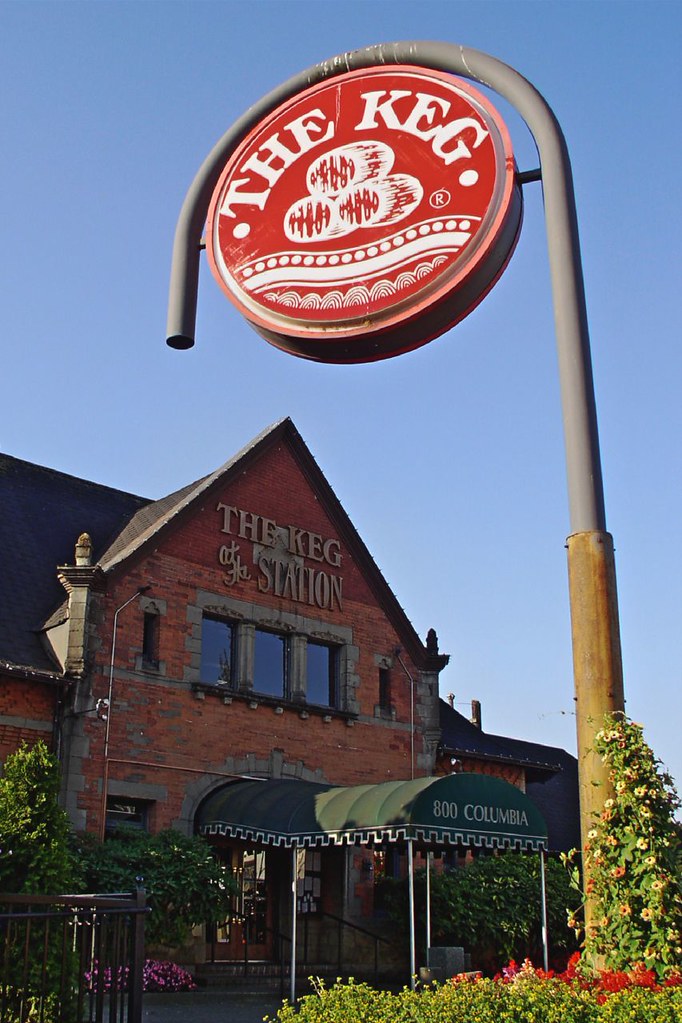
Upscale casual restaurants emerged in the 1970s, evolving out of a change in social norms. Consumers began to want the experience of a fun social evening at a restaurant with good value (but not cheap), in contrast to the perceived stuffiness of fine dining at that time. These restaurants are typically dinner houses, but they may open for lunch or brunch depending on location. Examples would include the Keg Restaurant. A closer examination of popular restaurant menus will show many items suitable for sharing amongst groups of people. Family style sharing platters that are passed back and forth between multiple diners. This adds to the desire for patrons to feel relaxed and comfortable while dining out with family or friends.
Catering and Banqueting
Catering makes up only 7.9% of the total share of F&B in Canada (Restaurants Canada, 2019) and comprises food served by catering companies at banquets and special events at a diverse set of venues. Note that banqueting pertains to catered food served on-premise, while catering typically refers to off-premise service. At a catered event, customers typically eat at the same time, as opposed to restaurant customers who are served individually or in small groups. The catering and banqueting experience has evolved tremendously to the point where guests who attend events expect restaurant-quality food and service. In keeping with this concept, the event planner will coordinate with the catering establishments that guests who attend the planned events have a choice of options for each course served. While surcharges may apply to meals because of the option choices the expectation is every bit as high from the customer.
Catering businesses (whether on-site or at special locations) are challenged by the episodic nature of events and the issues of food handling and food safety with large groups. Catering businesses include:
- Catering companies
- Conference centres
- Conference hotels
- Wedding venues
- Festival food coordinators
Spotlight On: Diner en Blanc
An interesting public event with a dining focus is Diner en Blanc, which is held in cities around the globe including Vancouver and Victoria. The Vancouver event has been running since 2011. The original concept was developed in Paris in 1988. Diners wear all white and bring their table, chair, and place settings with them to a secret location announced only hours before. Participants have the option to bring their own food or purchase a catered meal. Alcoholic beverages are also available for purchase on-site.
For more information, visit the Dîner en Blanc website.

While beverages make up part of almost every dining experience, some establishments are founded on beverage sales. Let’s look at these operations next.
Alcohol and Cannabis
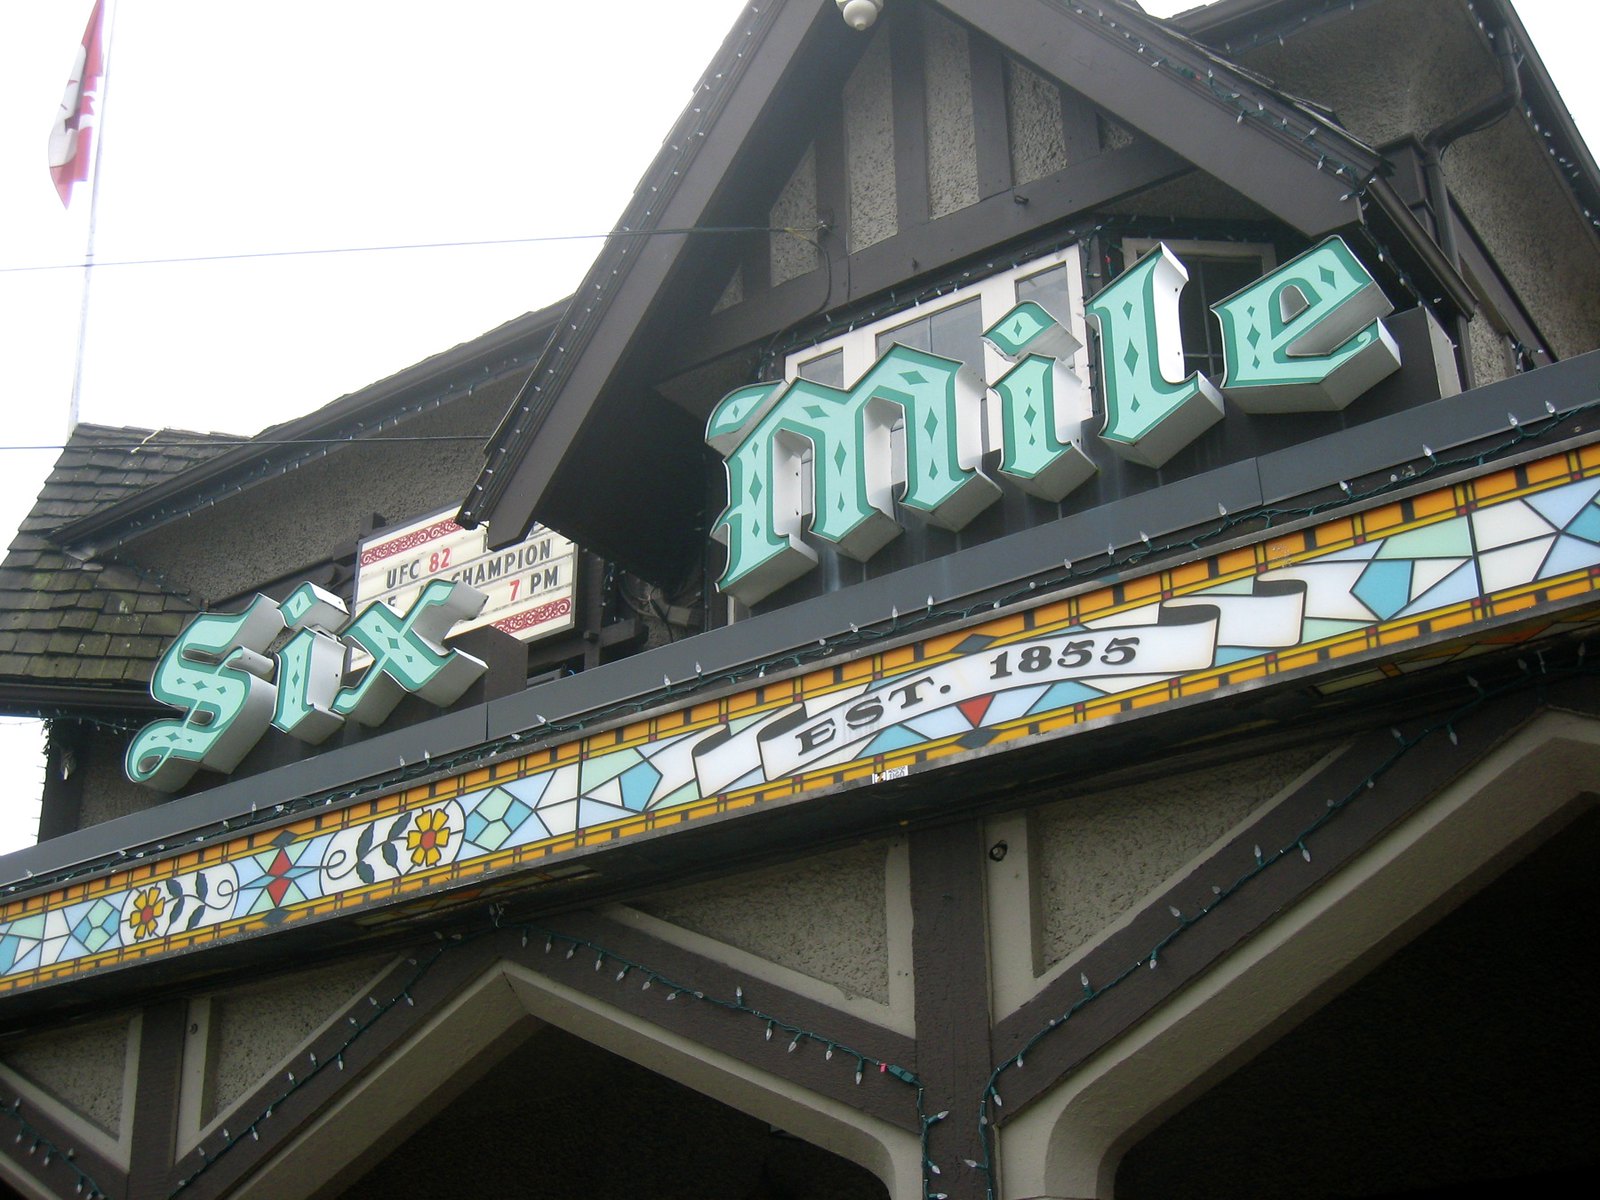
With a 3.5% market share (Restaurants Canada, 2019), the drinking establishment sector comprises bars, wine bars, cabarets, nightclubs, and pubs. All businesses and premises selling alcohol must adhere to their provincial Liquor Control and Licensing Acts.
Liquor licenses can be divided into liquor primary and food primary. As the name suggests, a liquor primary license is needed to operate a business that is in the primary business of selling alcohol. Most pubs, nightclubs, and cabarets fall into this category. A food primary license is required for an operation whose primary business is serving food. Some operations, such as pubs, will hold a liquor primary license even though they serve a significant volume of food. In this case, the license allows for diverse patronage.
One noteworthy change to the licensing of pubs in BC is that children are permitted in them if they are accompanied and attended by responsible adults. While not universally adopted by pubs to date, this change in legislation is an example of the fluctuating social norms to which the sector must respond.
On October 17, 2018, the Cannabis Act was introduced as law in Canada. which meant it became legal to consume marijuana and to sell marijuana in Canada. The Cannabis Act is in place to regulate such activities. In the 2019 Chef Survey Results conducted by Restaurants Canada Cannabis/CBD infused drinks ranked #1 and Cannabis/CBD infused food ranked #2 as the items Chef’s felt would be the next big thing in the restaurant business (Restaurants Canada, 2019).
Together the commercial ventures of QSRs, full-service restaurants, catering functions, and drinking establishments make up just over 80% of the market share. Now let’s look at the other 20% of businesses, which fall under the non-commercial umbrella.
Non-Commercial
The following non-commercial entities earn just under 20% share of the foodservice earnings in Canada (Restaurants Canada, 2019b). While these make up a smaller share of the market, there are some advantages inherent in these business models. Non-commercial operations cater predominantly to consumers with limited selection or choice given their occupation or location. This type of consumer is often referred to as a captured patron. In a tourism capacity such as in airports or on cruise ships, the accepted price point for these patrons is often higher for a given product, increasing profit margins.
Institutional
Often run under a predetermined contract, this sector includes:
- Hospitals
- Universities, colleges, and other educational institutions
- Prisons and other detention facilities
- Corporate staff cafeterias
- Cruise ships
- Airports and other transportation terminals and operations
Accommodation Foodservice
These include hotel restaurants and bars, room service, and self-serve dining operations (such as a breakfast room). Hotel restaurants are usually open to the public and reliant on this public patronage in addition to business from hotel guests. Collaborations between hotel chains and restaurant chains have seen the reliable pairing of hotels and restaurants, such as the combination of Sandman Hotels and Moxie’s Grill and Bar.
Vending and Automated Foodservices
While not generally viewed as part of the food and beverage sector, automated and vending services do account for significant sales for both small and large foodservice and accommodation providers. Vending machines are located in motels, hotels, transportation terminals, sporting venues, or just about any location that will allow for the opportunity for an impulse or convenient purchase.
Business Performance for Types of Food and Beverage Operators
As mentioned, the commercial sector comprises the
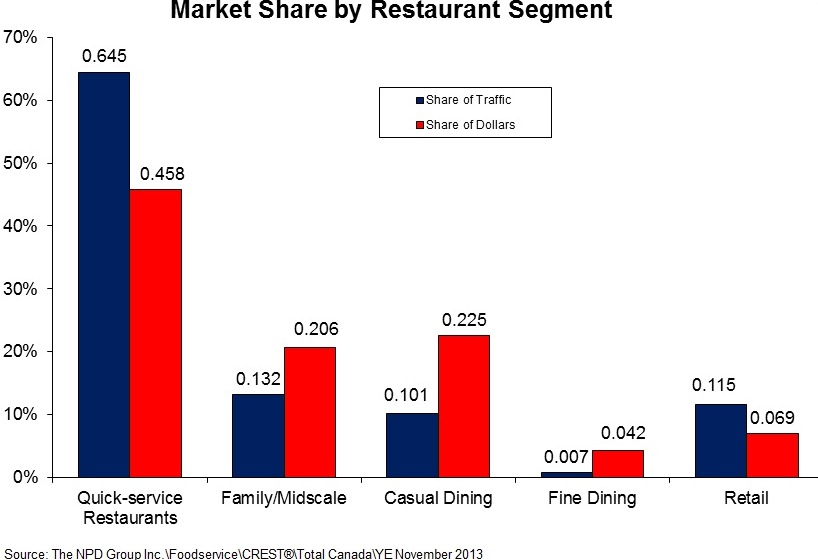
majority of dollars earned. Figure 4.9 illustrates the difference between the share of traffic and the share of dollars for each sub sector. We know that QSRs are much more economical and generally much busier than full-service restaurants. How do that traffic and low prices translate into market share for the different segments?
Figure 4.9 shows that QSRs attract two-thirds of all the traffic while earning less than half of the total dollars. Family/midscale and casual dining each attract half the dollars of QSR, but they do that from much lower shares of the traffic. Meanwhile, fine dining is patronized by less than 1% of the total restaurant traffic but earns 4.2% of the dollars. The growing force of convenience stores, department stores, and other retail establishments obtain a respectable 11.5% of traffic and 10.6% of the restaurant dollar.
As you can see, while QSRs attract the greatest number of guests, the ratio of dollars earned per transaction is significantly less than that of the fine-dining sector. This makes sense, of course, because the typical QSR earns relatively little per guest but attracts hundreds of customers, while a fine dining restaurant charges high prices and serves a select few guests each day.
Sales Per Segment
| [Skip Table] | ||||
| Type of Restaurant | 2017 Final ($ millions) | Segment Market Share (%) | 2018 Projected ($ millions) | Segment Market Share (%) |
|---|---|---|---|---|
| QSR | 30,464.2 | 44.5 | 32,027.8 | 44.4 |
| Full-service | 30,206.0 | 44.1 | 31,863.3 | 44.2 |
| Caterers | 5,400.5 | 7.8 | 5,688.2 | 7.9 |
| Drinking Places | 2,438.5 | 3.5 | 2,495.5 | 3.5 |
| Total Commercial | $68,509.2 | N/A | $72,074.8 | N/A |
| [Skip Table] | ||||
| Type of Restaurant | 2017 Final ($ millions) | Segment Market Share (%) | 2018 Projected ($ millions) | Segment Market Share (%) |
|---|---|---|---|---|
| Accommodation | 6,934.0 | 40.8 | 7,508.0 | 40.5 |
| Institutional | 4,735.0 | 27.9 | 5,125.0 | 27.6 |
| Retail | 2,569.9 | 15.1 | 2,936.3 | 15.8 |
| Other | 2,748.6 | 16.2 | 2,972.9 | 16 |
| Total Non-Commercial | $16,987.5 | N/A | $18,542.2 | N/A |
The sales revenues for the various segments are shown in Table 4.3. Note that QSRs and full-service restaurants are almost equal in their sales and almost completely dwarf the other commercial sectors of caterers and drinking places. It is also noteworthy that the commercial components have four times the sales volume of the non-commercial components.
| [Skip Table] | |||
| Channel | 2016 | 2017 | 2018 |
|---|---|---|---|
| Quick Service Rest. | $5.64 | $5.75 | $5.94 |
| Midscale dining | $12.47 | $12.82 | $13.01 |
| Casual dining | $17.56 | $17.85 | $18.24 |
| Fine dining | $43.59 | $43.63 | $44.16 |
| Retail foodservice | $4.76 | $4.82 | $4.94 |
| Total foodservice | $7.78 | $7.93 | $8.15 |
| Source: The NDP Group, 12 months ending December each year. | |||
Image Credits
Figure 4.1 The Keg at the Station by Jon the Happy Web Creative on Flickr is licensed under a CC BY 2.0 licence.
Figure 4.2 North Arm Farm Strawberry + Rhubarb Pavlova by Ruth Hartnup on Flickr is is licensed under a CC BY 2.0 licence.
Figure 4.4 Birthday dinner at one of Vancouver’s finest by Jan Zeschky on Flickr is is licensed under a CC BY 2.0 licence.
FIgure 4.5 Dîner en Blanc Vancouver 2012 by Maurice Li Photography on Flickr is is licensed under a CC BY-NC-ND 2.0 licence.
Figure 4.6 Six Mile by Alan Levine on Flickr is is licensed under a CC0 1.0 public domain licence.
Figure 4.7 Market Share by Restaurant Segment by LinkBC is used under a CC-BY-NC 2.0 license.
- The average cheque size includes taxes but excludes tips. ↵
Operations whose primary business is food and beverage.
Establishments where food is served, but where the primary business is not food and beverage service.
An establishment where guests pay before they eat; includes counter service, take-out, and delivery.
Casual and fine dining restaurants where guests order food seated and pay after they have finished their meal.
Licensed food and beverage establishment characterized by high-end ingredients and preparations and highly trained service staff.
Total sales divided by number of guests served.
A restaurant type that is typically open for all three meal periods, offering affordable prices and able to serve diverse tastes and accommodate large groups.
When a menu is created to make multiple uses of a small number of staple pantry ingredients, helping to keep food costs down.
A restaurant based on the cuisine of a particular region or country, often reflecting the heritage of the head chef or owner.
Emerging in the 1970s, a style of restaurant that typically only serves dinner, intended to bridge the gap between fine dining and family/casual restaurants.
The type of licence needed in BC to operate a business that is in the primary business of selling alcohol (most pubs, nightclubs and cabarets fall into this category).
A licence required to operate a restaurant whose primary business is serving food (rather than alcohol).
Consumers with limited selection or choice of food or beverage provider given their occupation or location.
