
18 Experimental Characterization of Unknown Capacitors
Experimental Characterization of Unkown Capacitors
This lab is designed to align with AAOT science outcome #1: Gather, comprehend, and communicate scientific and technical information in order to explore ideas, models, and solutions and generate further questions.
Materials
- digital device with spreadsheet program
- digital device with internet access
ObjectiveS
- Diagram a circuit that can be used to measure capacitor charging and discharging curves.
- Analyze charging and discharging curves to determine the time constant for each.
- Use resistor codes to determine resistance of a resistor
- Calculate capacitance from the time constant and a known resistance value.
- Calculate the leakage time constant
- Use an oscilloscope to measure a time constant in the microsecond range and calculate the associated capacitance value.
Methods
Experimental Methods
The following video demonstrates the experimental setup and the collection of all necessary data for this lab. You can copy the data from this online spreadsheet and paste into your own for analysis.
1) Draw a standard circuit diagram of the capacitor charge/discharge circuit that is described/shown in the video.
Analysis Methods for Capacitor # 1 (Electrolytic)
Discharging Time Constant
2) The data in the spreadsheet contains data from before the switch was thrown to begin discharging. We will need to adjust the dat in order to model the data with the expected type of function. Plot the voltage vs. time for the discharging data. Be sure to title your graph and label your axes, including units.
3) What function do you expect will fit the voltage discharge data? Write it below and explain your reasoning and/or cite your source.
4) In order to apply the expected fit function we need to adjust the time values so that discharge begins at time zero. Identify the point at which the voltage first begins to drop. Keep one voltage data point before that, and delete the previous values in the voltage column only (shift the voltage values up). This will shift the time axis so that time zero corresponds to the initial voltage just before charging begins. (The original raw data is stored in the online spreadsheet so we aren’t worried about losing data that could be important later).
5) Fit the data with the function type you chose above. Write the resulting fit function and R2 value here:
6) What is the value of the discharge time constant indicated by you fit function? [Hint: You don’t see this value explicitly in the fit function produced by your spreadsheet, but you do see it’s inverse.]
Charging Time Constant
7) Repeat steps 1 and 2 for the charging data.
8) What type of function should fit the voltage vs. time while charging? Explain your reasoning and/or cite your source.
9) This type of function may not be an option to choose from in your spreadsheet. To get around that, make a new column that plots the difference between the power supply voltage and the capacitor voltage. (To find the power supply voltage you can look at the last voltage value in the charging data, which should be similar to the first value in the charging data). No change your graph options to instead plot the difference in voltage vs. time.
10) What type of function should fit the voltage difference data while charging? Show your work in demonstrating your answer mathematically.
11) Fit the correct function type to the charging data. Record the resulting fit function and R2 value here:
12) What is the value of the discharge time constant indicated by you fit function?
13) We expect the discharging and charging time constants to be the same. Does this appear to be the case? Explain your answer.
14) To calculate the capacitance of the capacitor from the time constant value we need to know the value of the resistor. Use the resistor code shown in the video to determine the resistance. Cite any sources you used.
15) Average the two time constants and use the average value to calculate the capacitance of the capacitor and provide answers in both Farads and µF (microFarads) Show your work.
16) Calculate a % difference between the value you found experimentally and the value printed on the capacitor.
Leakage Time Constant
17) Now we would like to determine the time constant due to leakage. Repeat steps 1-5 for the leakage data.
18) How long would it take for this capacitor to lose to 63% of it’s voltage (drop to 37% of it’s original voltage)? Explain/show your work.
19) How long would it take this capacitor to lose half of its voltage? Show your work.
20) What is the half-life for charge stored on this capacitor? Explain.
Conclusions
21) Based on the results of your experiments, are you confident in the capacitance value you found? Explain in terms of R2 values for your fits and relative similarity between your two values.
22) Would you consider using this capacitor in a circuit that required the capacitor to maintain at least 50% of it’s voltage for 30 seconds? Explain.
FURTHER QUESTIONS
We were unable to characterize the time constant of the small ceramic capacitor because it was too short compared to the minimum sampling period of the digital voltage probe (0.01s). However, we were able to use slow motion video to capture a faint trace of the discharge on the oscilloscope display. The image below shows just such a frame from that video.
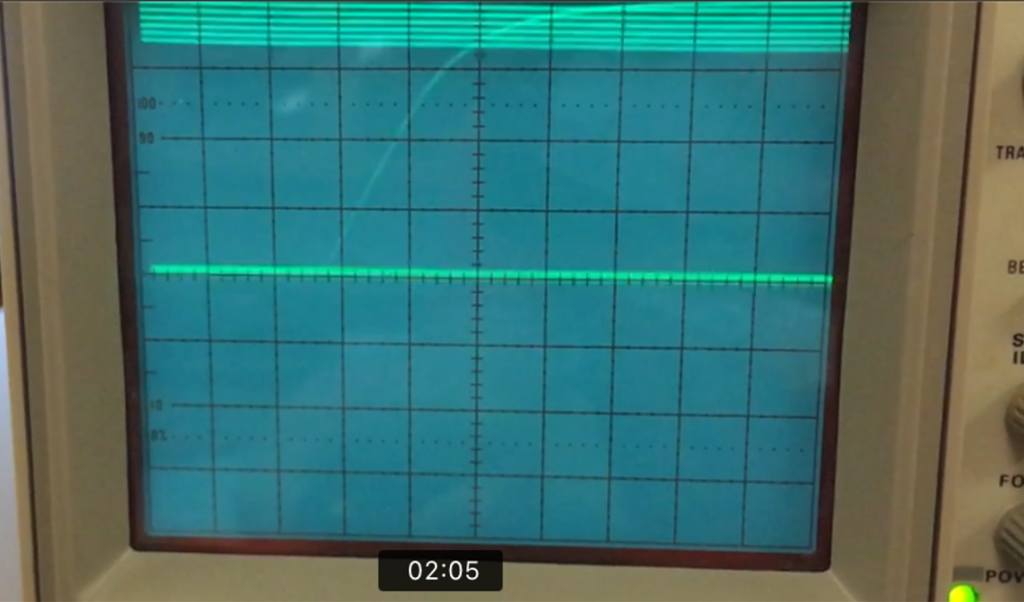
In order to use this trace to determine the time constant we need to know the scale. The following photo shows the oscilloscope settings.
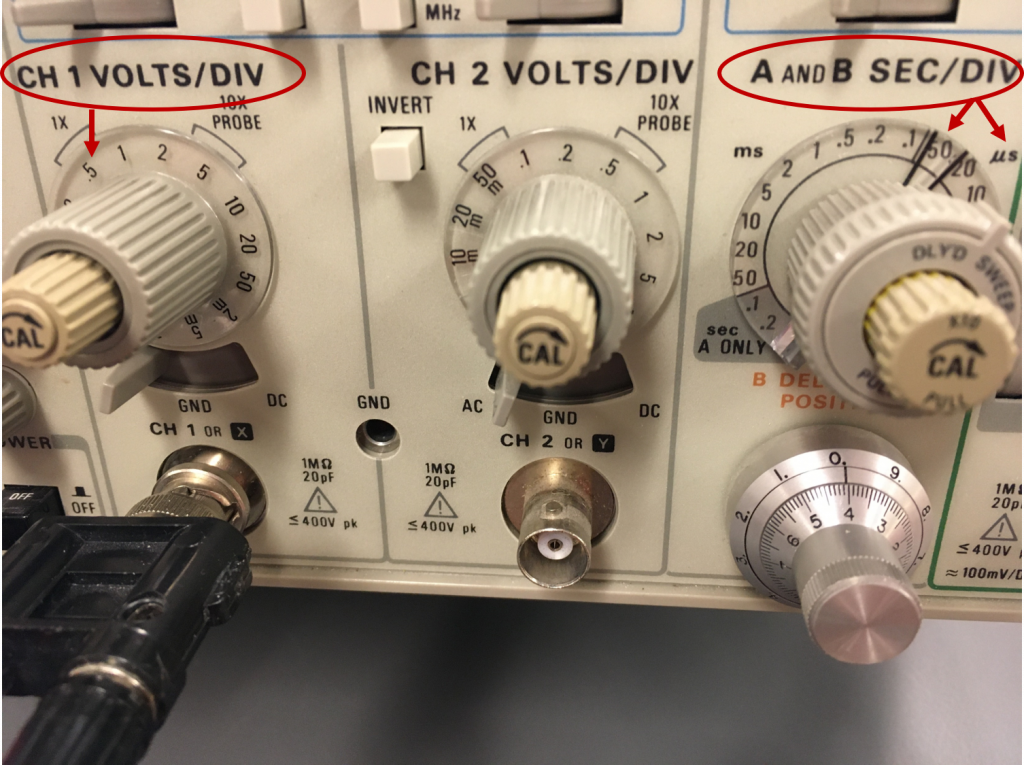
As highlighted in the photo, above the volts per division (vertical axis) is set to 0.5, so the total voltage change seen in the trace is 2 volts (four boxes). The time per division is set to 50 µs, so the time to nearly full charge is about 100 µs. To find the time constant we want to measure the time for the voltage to reach 63% of the charging voltage (2 Volts).
22) Calculate 63% of 2V.
23) Notice that there are 4 small tick marks within the large boxes, which divides them into division of 1/5 the large box value. Use a ruler to help you find where the curve reaches 63% of 2V and then read off the time from beginning of charging to that point. Record the time constant below. (The large boxes are 50 µs on the horizontal axis, so each small tick mark is 10 µs).
25) Now you know know the time constant for the small capacitor to discharge through the resistor (which hasn’t changed). Calculate the capacitance value and provide answers in both Farads and nF (nanoFarads). Show your work. .
As discussed in the video, we were unable to trust the measured leakage discharge curve for the small capacitor because we could not verify the apparent leakage discharge was not actually discharge through circuitry of the the voltage probe. (This is a common difficulty in measuring leakage time constants for small capacitors). However, the voltage probe is designed to have a 10MΩ input impedance (we’ll learn more about impedance when we discuss AC circuits, but for this DC circuit that means a 10MΩ input resistance). Now that we know the capacitance and we know the resistance in the voltage probe circuit we can calculate the expected time constant for discharge through the voltage probe.
26) Calculate the expected time constant for discharge through the voltage probe. Show your work.
28) The measured leakage discharge data for the small capacitor has already been processed for you. Plot the voltage vs. time data, fit the expected function type, and determine the time constant for this discharge. Write your fit function, R2 value, and time constant below.
29) If the measured leakage discharge time constant is much smaller (about 10x) than the expected time constant for discharge through the voltage probe then we might assume that probe circuitry discharge is not contributing significantly to the measured discharge, in which case we might trust the measured time constant to be the true leakage time constant. However, if that is not the case and the expected time constant for probe circuitry discharge is actually comparable to the measured leakage time constant then we know probe discharge is likely contributing significantly to the overall discharge. In that case, we can’t trust the time constant we found above to be the true leakage time constant. Which is the case in this experiment? Explain your answer.
