
4 North America
Learning Objectives
- Identify the key geographic features of North America
- Describe how the process of industrialization shaped North American geography
- Analyze how the patterns of industrialization impacted development in North America
- Describe the current patterns of inequality in the United States
4.1 North America’s Physical Setting
The giant redwoods that stretch over California’s Redwood National Park are the tallest trees on Earth, towering to over 100 meters (328 feet). These trees are also exceptionally old. One such tree, known as “General Sherman,” is the largest tree in the world by volume and is believed to be over 2,000 years old. At the time General Sherman first emerged from the ground, North America was settled by a number of indigenous groups. It would be 1,000 more years until Europeans would make contact with the Americas. Today, though many of the redwoods still remain, both the physical and human landscape of North America have profoundly changed.
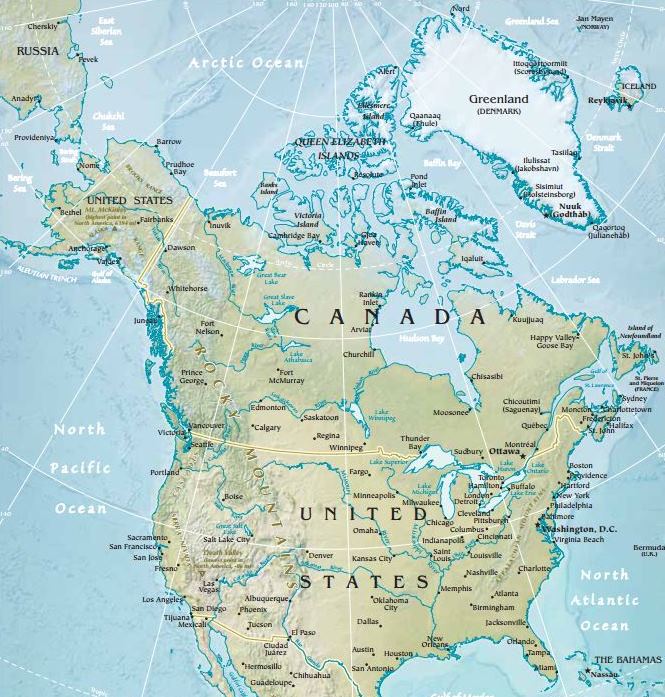
Traditionally, the continent of North America extends from the Canadian Arctic through the United States and Mexico to the narrow Isthmus of Panama (see Figure 4.1). When considering the “region” of North America, however, that is, the area united by common physical and cultural characteristics, there are distinct similarities between Canada and the United States in terms of language and a shared history that are quite different from their Spanish-speaking neighbors to the south. Although the narrow strip of land that typically divides North and South America makes for an easy way to divide these two regions, in many ways, Middle America is largely a transition zone between more powerful economies to the north and south. Mexico, for example, culturally resembles countries like Guatemala and Honduras to the south while physiographically, it resembles the southwestern United States. Thus, the United States and Canada are discussed in the North America chapter while Mexico and Central America are considered alongside the chapter on South America.
The physiographic regions of North America are well-defined and are commonly recognized by its residents (see Figure 4.2). Someone might say he is from “Appalachia,” for example, or that she grew up in the “Rocky Mountains.” In general, the physiographic regions have a strong north-south alignment. Climatically, the region is quite diverse, ranging from tundra in northern Canada and Greenland to semi-arid desert in the southwestern United States. These diverse physical conditions have enabled North America to have a wide variety of natural resources, but have also contributed to significant regional differences.
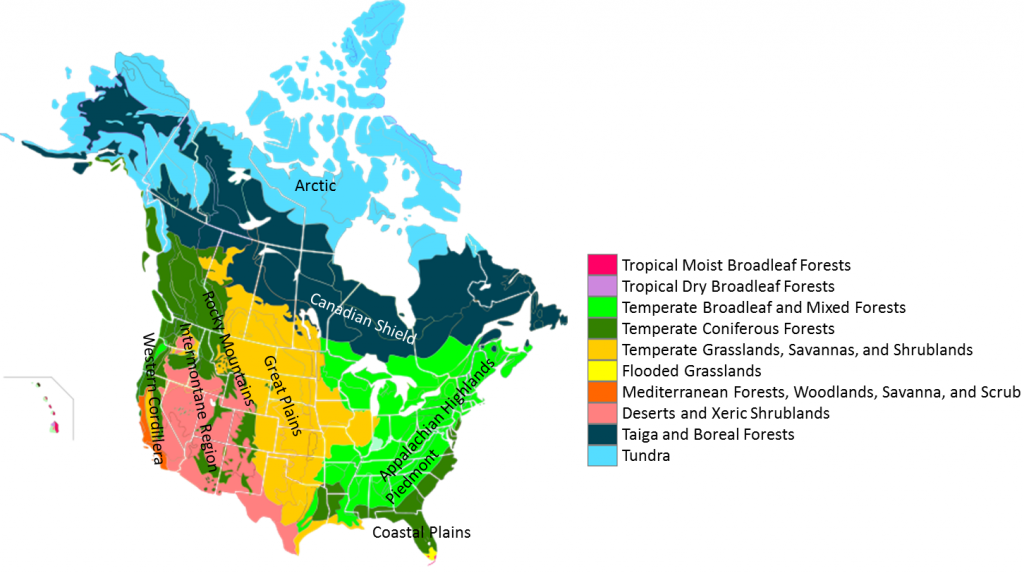
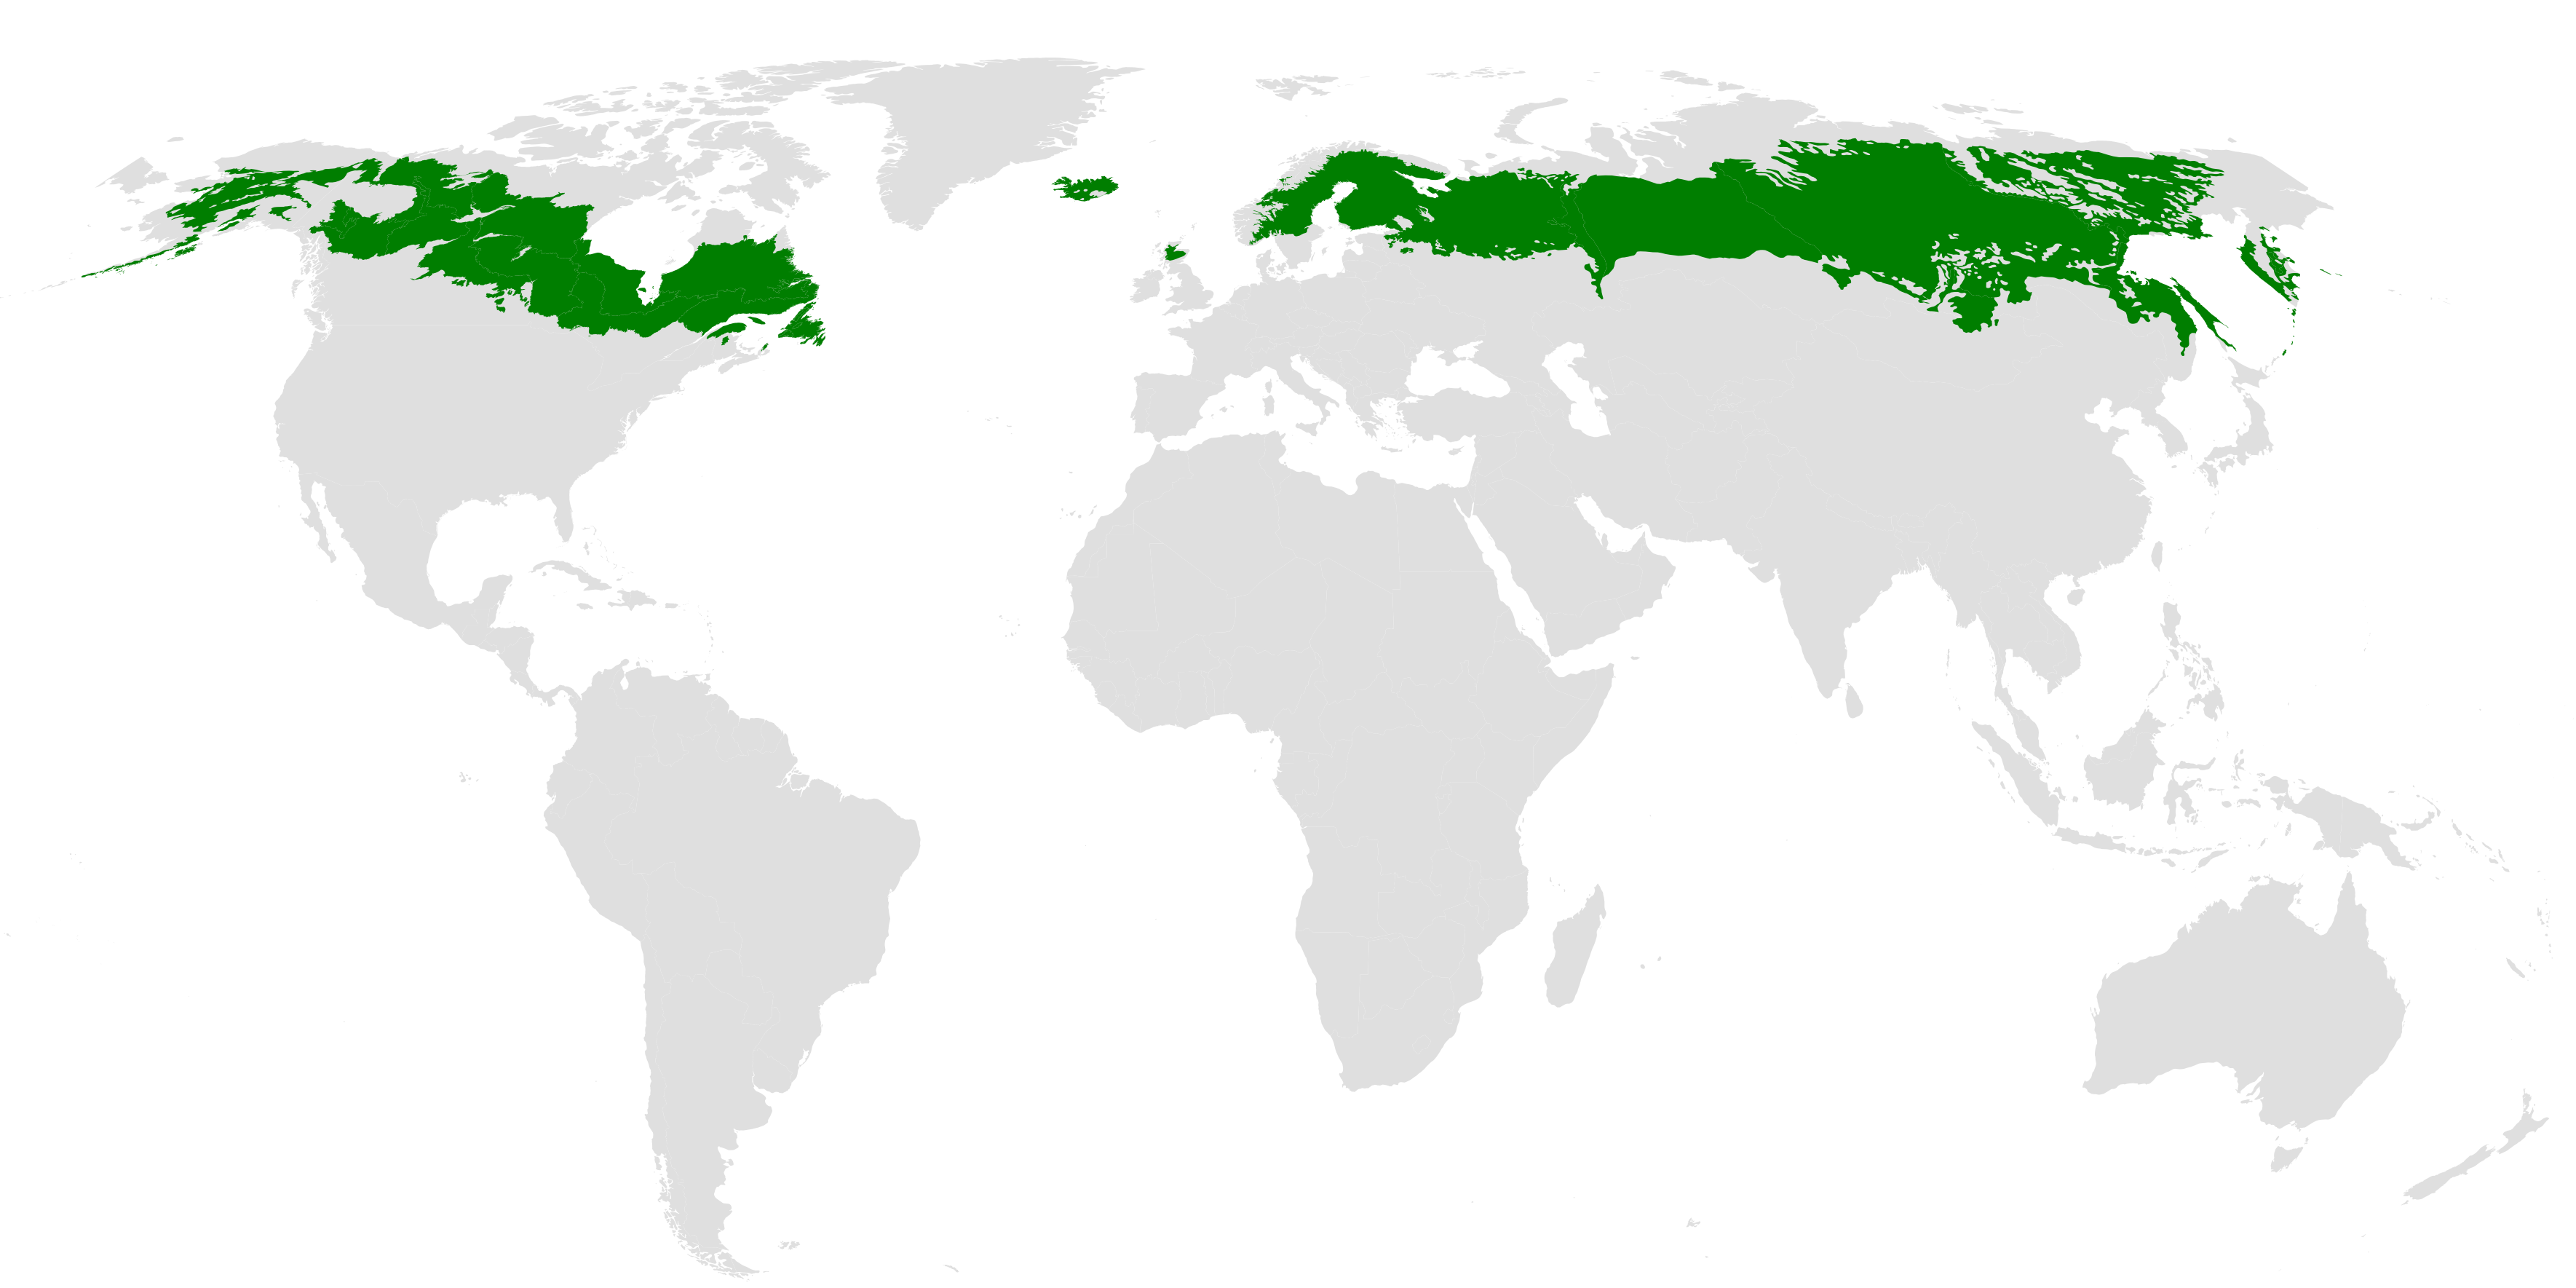
Most of Canada’s land area consists of boreal forest, known as taiga in Russia (see Figure 4.3). This boreal forest area consists of coniferous trees, such as spruce and pine, and is characterized by a cold climate. For Canada’s indigenous communities in particular, this large stretch of woodland has been an important resource. The rocky landscape of the Canadian Shield extends from the Arctic regions of Central Canada west through Quebec and is among the oldest geologic formations on Earth. It also has some of the world’s richest mineral areas.
As with the physical landscape, the climate zones of North America are diverse. In general, North America has a relatively simple weather system. As you increase in latitude north, the temperature decreases and as you travel west to east, the precipitation increases. Thus, California, on the west coast, is relatively warm and dry, while Florida on the east coast is hot and wet.
Most of North America, to include Mexico, Greenland, and some of the Caribbean, is situated on the North American plate and is thus relatively geologically stable (see Figure 4.4). One notable exception, however, is the Juan de Fuca Plate, which is subducting under the North American plate near California and Vancouver Island, an area known as the Cascadia subduction zone. Severe earthquakes, generating tsunamis, have occurred here roughly every 500 years; the last major earthquake in the area was in 1700 CE. Just to the south, the San Andreas Fault running along the edge of California forms the boundary between the Pacific Plate and the North American Plate. This is a transform plate boundary, with the two plates sliding past each other horizontally. San Francisco is located on this fault line and the area has experienced numerous earthquakes.

North America has a number of significant rivers, some of which are used for shipping and others for hydroelectric power. The longest North American river is the Missouri, which forms in Montana and flows into the Mississippi River. The Mississippi River is largely considered to be the most important waterway in terms of commercial transportation. The Port of South Louisiana, located along the Mississippi, is the largest port in the United States in terms of tonnage.
Below North America lies a number of aquifers, or underground layers of permeable rock that hold groundwater. The largest of these aquifers is the Ogallala Aquifer located in the central United States stretching from South Dakota down to Texas. This aquifer supplies water to much of the Great Plains – it actually supplies about one-third of all groundwater used for irrigation in the United States. While aquifers are beneficial for irrigation, they replenish their water supplies relatively slowly through rainfall. Depletion of the Ogallala Aquifer has accelerated over the past few decades and currently water is being taken out of the aquifer at a faster rate than it can be replaced. Once all of the water is depleted, it will take around 6,000 years to naturally replenish. Groundwater conservation initiatives in the area have aimed to slow the depletion rate by encouraging farmers to practice sustainable irrigation methods.
While farmers have been encouraged to conserve water, groundwater depletion is just one of the many environmental concerns currently facing North America’s farmers. Sustainable agriculture more broadly remains an important initiative. This type of agriculture looks at farming’s effect on the larger ecosystem and seeks to produce agriculture in a way that doesn’t negatively impact the ecosystem in the long-term. It is essentially farming that can be sustained and seeks to minimize water use, soil erosion, and harmful chemicals. Globally, over one-third of all agricultural land has become degraded due to poor land and resource management. Soil is a finite resource, and topsoil can take over 500 years to form! Traditional forms of agriculture, where you might see large stretches of tilled land, can often lead to topsoil erosion. Through sustainable agricultural practices, soil erosion rates have slowed in the United States over the past several decades.
Many environmental problems like topsoil erosion and groundwater depletion affect a wide area and can have far-reaching effects beyond areas where the environment is not being sensitively managed. Acid rain, for example, formed from sulfur dioxide and nitrogen oxide emissions, can have damaging effects far beyond the areas that are emitting these gases (see Figure 4.5). When cars or factories burn fossil fuels, those nonrenewable sources of energy formed by the remains of decayed plants or animals, they release a number of chemicals including sulfur and nitrogen. These gases react with water in the atmosphere to form a highly acidic rain that can damage plants and animals. The lower the pH value, the more acidic a substance is; pure water has a pH of 7. Acid rain can have a pH of around 5.0, or even below 4.0 in some areas. Pickles, by comparison, have a pH of around 5.20, so you can imagine the devastating effects of this acidic precipitation on the environment. The strict regulation of fossil fuel emissions since the 1970s has dramatically reduced instances of acid rain in the United States but some argue that further regulation is needed to address changes in global climate and other pollution concerns.

4.2 North American History and Settlement
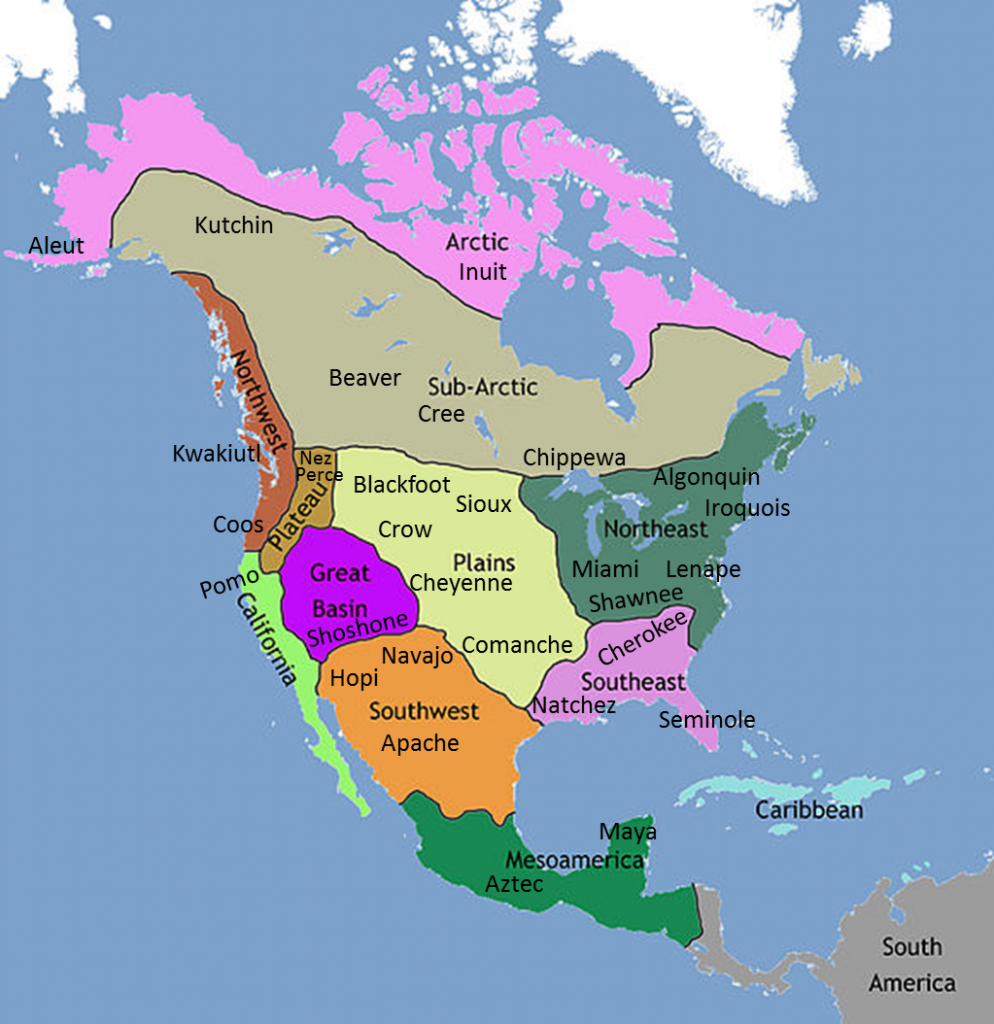
Although Christopher Columbus is often credited with “discovering” America, the landmass was inhabited long before Europeans made contact. Most likely, early migrants to the Americas traveled from Asia through the Beringia land bridge that once connected Siberia and Alaska over 10,000 years ago. These indigenous peoples, known as First Nations in Canada or Native Americans in the United States, were divided into a number of different groups, some consisting only of a few small families and others encompassing vast territories and empires (see Figure 4.6). Some groups practiced hunting and gathering but many practiced settled agriculture. Before European contact, there were an estimated 50 million indigenous people living in North and South America.
European colonization completely changed the cultural landscape of North America. In 1492 CE, Columbus made contact with what are now the Bahamas, Cuba, and the island of Hispaniola, spurring Spanish and Portuguese colonization of the Americas. The term “Indian” was actually originally used by Columbus who thought he had arrived in the East Indies, what we now refer to as East and Southeast Asia. Early French and English settlements were not successful, but over time, they too gained control of territory and founded permanent colonies. The easternmost indigenous groups were the first to experience the impacts of European invasion. Many were relocated, often forcibly, to the interior of North America to free up land for European settlement. Disease and war would have a devastating effect on the indigenous groups of the Americas. European settlers and explorers brought smallpox, measles, and cholera – diseases previously unknown to North America. In some areas, 90 percent of the indigenous population died.
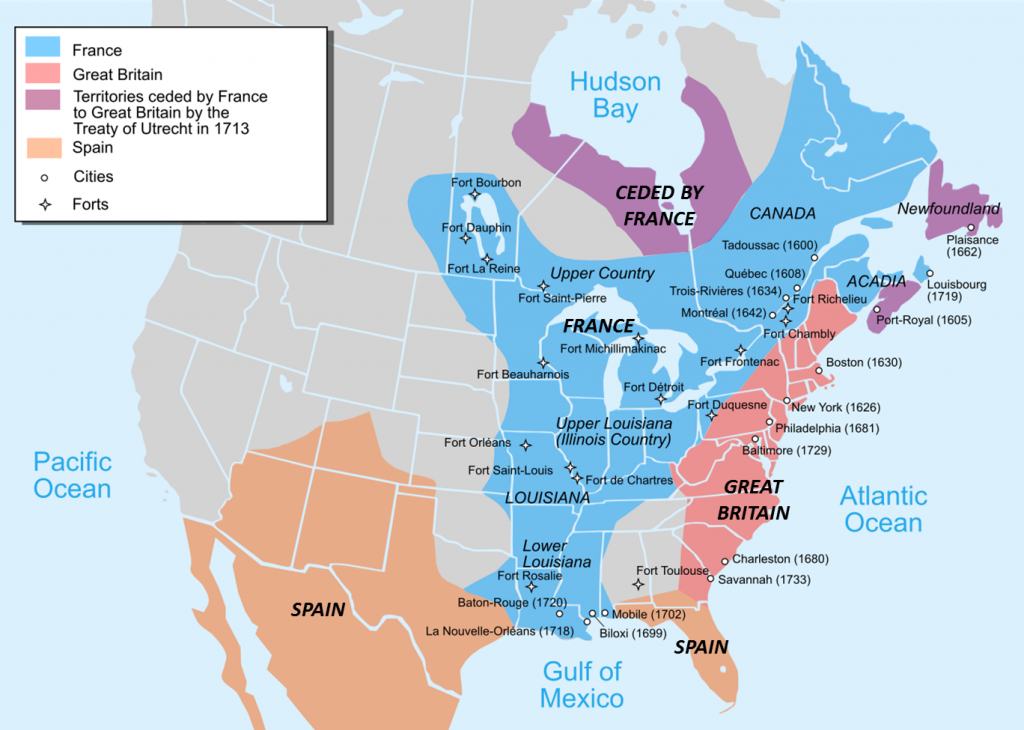
By the early 1700s, France, the United Kingdom, and Spain had established formal colonies in the Americas (see Figure 4.7) and the population geography of North America today is largely rooted in the colonial developments during this time period. The British primarily set up settlements along the coast, including the thirteen colonies that would declare independence from the United Kingdom and form the basis of the United States. The French colonized much of Canada and the area surrounding the Mississippi River. Their primary objective was fur trading, and they founded a fur trading outpost at what would later become the city of Quebec. The Spanish colonized present-day Florida as well as much of Middle America, stretching into what is now the southwestern United States. They sought resources like gold, the expansion of trade, and opportunities to spread the Roman Catholic faith to indigenous groups.
The early British colonies had highly specialized economies, not unlike the patterns seen in present-day North America. The New England colonies, around the Massachusetts Bay area, were centers of commerce. The Chesapeake Bay area of Virginia and Maryland had a number of tobacco plantations. In the Middle Atlantic, around New York, New Jersey, and eastern Pennsylvania, were a number of small, independent-farmer colonies. Further south, the Carolinas were home to large plantations cultivating crops like cotton.
These large plantations relied on slave labor, a dark legacy that would last for 250 years in North America. Initially, colonists partnered with indentured servants. These laborers paid to their passage to North America by agreeing to work for an employer under contract for a set number of years. These indentured servants often worked on farms, and once their contract expired, they were free to work on their own. Over half of all European immigrants to the Americas before the American Revolution were indentured servants.
As indentured servants gradually earned their freedom, the system of indentured servitude was replaced with slavery. The Portuguese were the first to bring slaves from Africa to the Americas during the 1500s. England, France, Portugal, and the Netherlands would all later join in the transatlantic slave trade, with England dominating the slave trade by the late 17th century. The vast majority of slaves were destined for sugar colonies in the Caribbean and Brazil. Less than 10 percent would be brought to the North American colonies, but this number still represented hundreds of thousands of people. It is estimated that a total of 12.5 million Africans were shipped to the New World as slaves.
During British colonization, slaves worked as house servants or laborers in the northern colonies and farm workers in the south. Britain formally abolished slavery in 1833, but slavery was so entrenched in the economies of the southern United States that it would take a civil war to end the practice. In their secession statement, Mississippi explained its reasoning for leaving the union: “In the momentous step which our State has taken of dissolving its connection with the government of which we so long formed a part, it is but just that we should declare the prominent reasons which have induced our course. Our position is thoroughly identified with the institution of slavery – the greatest material interest of the world. Its labor supplies the product which constitutes by far the largest and most important portions of commerce of the earth” (http://avalon.law.yale.edu/19th_century/csa_missec.asp).
When we think about the Civil War, it is important to understand the geographical differences between the north and south and to remember that the northern states profited on slavery in the south. Just as geographers can divide the world into core and peripheral countries today, the early United States can similarly be analyzed in terms of its core and periphery. The southern states were indeed peripheral in terms of their economic development. Slavery, essentially free labor, provided the southern states with the maximum profit for their commodities and the notion of “othering,” the idea that people who look different from you are definitively not you, combined to create an institution that was deeply a part of the southern culture and economy. Even after slavery was abolished in the United States in 1865 with the 13th Amendment to the Constitution, the legacy of slavery and the tendency to consider African Americans as “other” remained. It would be another 100 years before laws were passed in the United States that would bar discrimination based on race, color, religion, sex, or national origin. Even still, racial and ethnic prejudices continue to be a significant social issue.
4.3 Industrial Development in North America
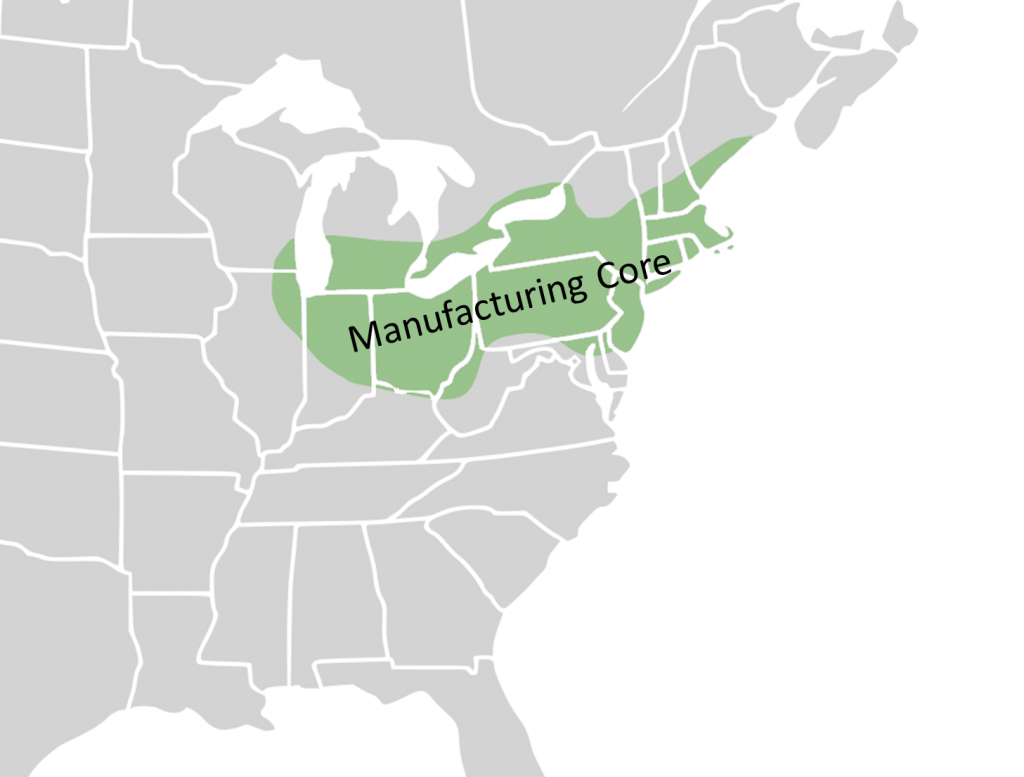
As the Industrial Revolution began in the United Kingdom in the mid-1700s and spread across Europe, the United States was still primarily based on agriculture and natural resource production. Some of the early innovations in industry were thus based on these raw resources, such as the cotton mill and textile factories. Hydropower was the key source of energy for these early manufacturing plants and thus they were located almost exclusively in the northeastern United States, the only area with fast-moving rivers. After the Civil War in the 1860s, steam power manufacturing spread through the United States allowing the southern states to industrialize. The manufacturing core region in particular had high concentrations of industrial output (see Figure 4.8). Eventually, as the United States continued to industrialize, they overtook the United Kingdom by the early 20th century as the global leader in industry.
The geography of North America shaped industrial development and regional specializations. In the Pittsburgh-Lake Erie region, for example, abundant deposits of iron fueled steel manufacturing, inspiring the name of Pittsburgh’s professional football team. In the south, textile manufacturing developed and remains a regional specialty in many areas still today. Coal from Appalachia fueled industrial development in the Mid-Atlantic States. These regional specializations, and the fact that the southern states continued to rely on agricultural production for some time, further exacerbated economic differences between the north and south.
The Industrial Revolution shaped the pattern of human settlement in North America. As in Europe, industrial development occurred in urban areas spurring people to move from rural farming communities to the cities to find work. In 1790, around 5 percent of the US population lived in urban areas. At the end of the Civil War, as industrialization began to diffuse across the continent, around 20 percent lived in cities. By 1920, more people lived in cities than in rural areas. Today, over 80 percent of people in the US live in cities.
In addition, industrial development spurred large-scale migration, particularly from the peripheral regions of Eastern Europe, as people moved to the US to find work. Between 1865 and 1918, 27.5 million people migrated to the US. Conditions for many of these workers was dismal and child labor wouldn’t end until 1930. Asians primarily migrated to the western United States where they were often met with strong anti-immigrant sentiment. Legislation actually limited immigration from China and Japan at the turn of the 20th century. Improvements in rail transportation further diffused both industrial development and the population of workers.
For the past several decades, manufacturing has been declining in the United States as people have shifted to jobs in service industries, like retail and finance. Still, the US remains the world’s second largest manufacturer behind China. This process is referred to as deindustrialization and is accompanied by both social and economic changes as a country shifts from heavy industry to a more service-oriented economy.
4.4 The North American Urban Landscape
North America’s urban landscape has been shaped both by colonization and by industrialization. Most of the early settlements in the region were small and were located close to the eastern coast. The Appalachian Mountains provided a formidable obstacle for early settlers before 1765. As settlement and colonization expanded, people moved steadily westward, still primarily situating close to waterways. Even today, most urban centers are located close to water.
During this time, immigration and natural growth expanded North America’s population. In 1610, the population of what is now the United States, excluding indigenous groups, was a meager 350 people. In just 200 years, the population reached over 7 million. In 1620, just 60 people occupied what is now the Canadian city of Quebec. Today, the population of the United States stands at over 318 million and Canada’s population is over 35 million and both countries are highly urbanized.
North America’s cities themselves have also changed over time. The traditional North American city had a core commercial area, called the central business district (or CBD), surrounded by worker’s homes. Density was generally highest near the city center and decreased as you traveled outward away from the urban center and into the rural areas.
As deindustrialization occurred, suburbanization replaced the previous rural to urban migration. The rush to move to the city center for jobs in industry was replaced by the desire for more land and spacious, single-family homes. With the decrease in housing density and the increase in both home size and acreage, however, came sprawl. Urban sprawl refers to the expansion of human settlements away from central cities and into low-density, car-dependent communities. Sprawl is associated with urban decentralization, the spreading out of the population that resulted from suburbanization. Counterurbanization, the shift in populations from urban centers to suburban and rural settlements, has been prevalent in North America since the end of World War II. In some areas, rural populations have actually grown as a result of counterurbanization. As sprawl continued, edge cities developed. An edge city is an urban area situated outside of the traditional central business district.
In historical North American cities, the central city was home to most of the jobs and services and had relatively high density housing. Because everything was located close to the city center, people could often walk from home to work or take efficient transit systems like streetcars. Urban decentralization has not only resulted in sprawl but has also created suburbs that are entirely dependent on automobiles (see Figure 4.9).

Few suburbs have shops or restaurants, and most people living in suburbs have to commute to work. Since jobs are no longer clustered in the city center, cities have faced challenges trying to develop mass transit systems that tie together numerous disconnected suburban developments and link people with their places of work, many of which are now located in surrounding edge cities.
Toronto, for example, Canada’s largest city, has a population of 2.8 million within its city limits. Its surrounding suburbs, however, have grown considerably in recent decades. The entire metropolitan area now has a population of over 5.5 million and the average daily commute time is over 1 hour. To the south, Washington, DC’s urban decentralization has extended north into Maryland and south into Virginia. Its subway system, a technological marvel when it opened in 1976, has not kept pace with its urban growth and numerous sections of rail lines were shut down for an extended period in 2016 and again in 2019 to conduct major system and station repairs.
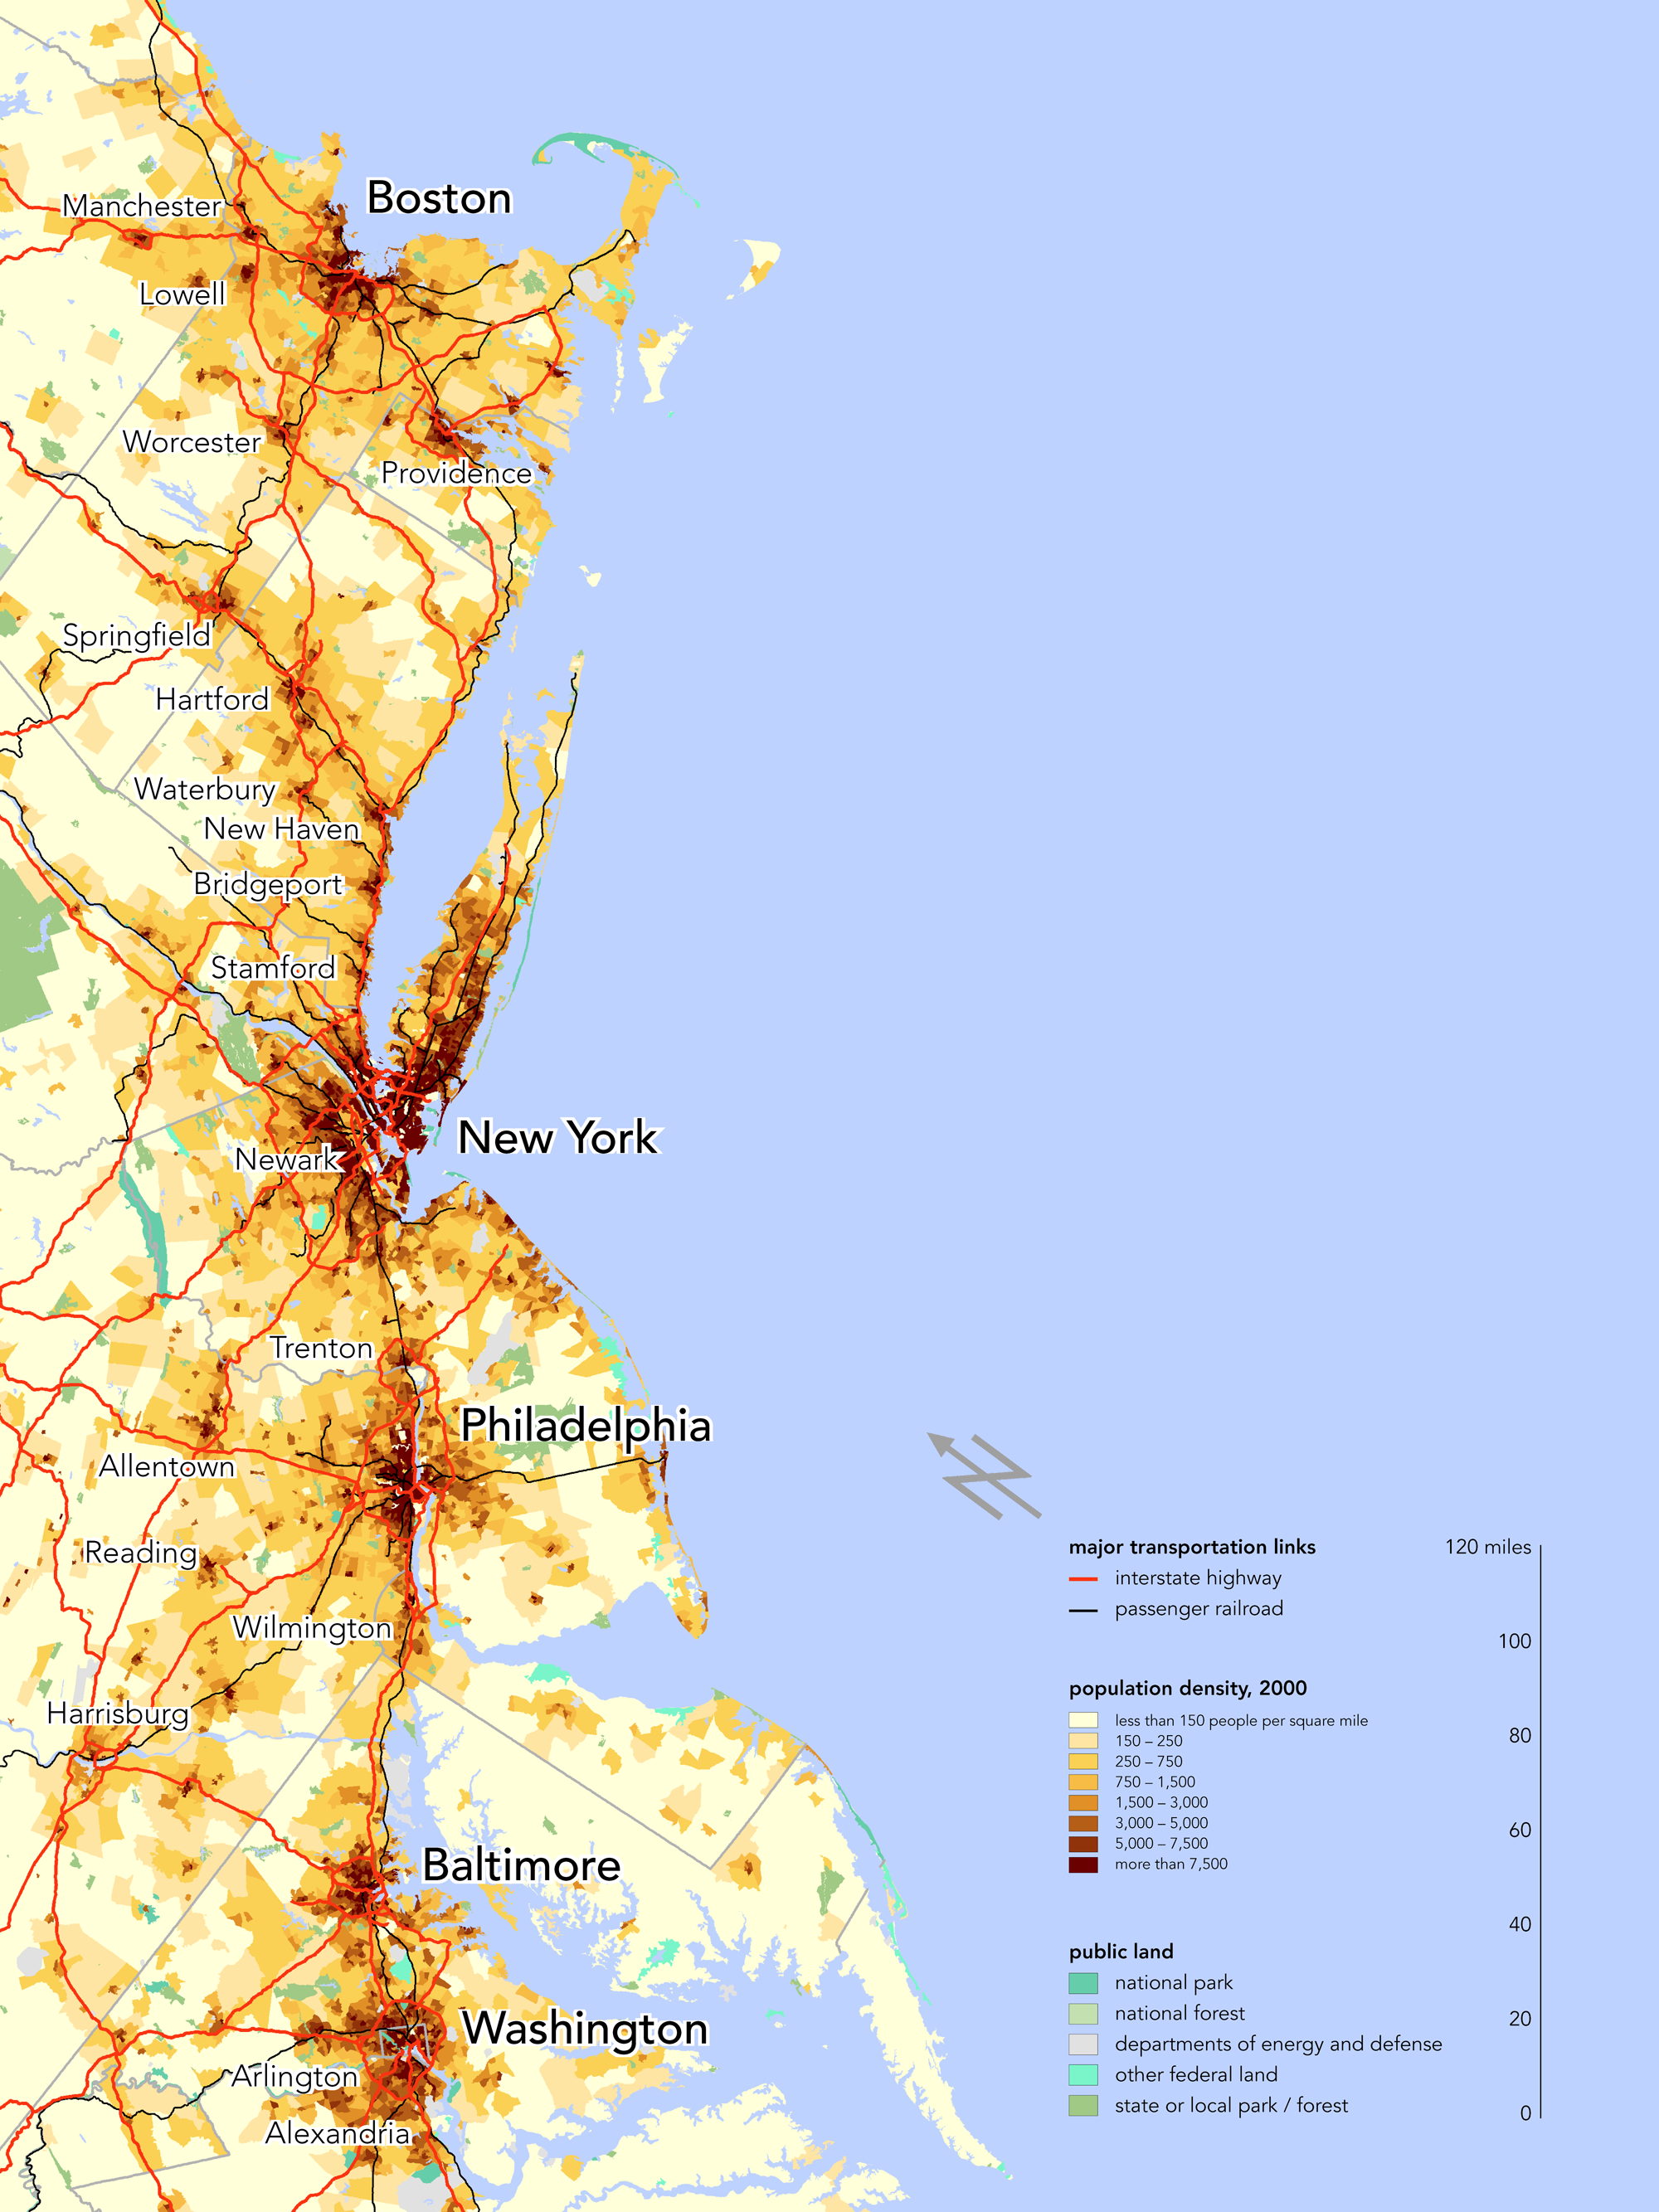
In some areas, the metropolitan area has grown so large that it actually overlaps with neighboring metropolitan areas. This is referred to as a megalopolis. The Northeast Megalopolis extends along the Interstate 95 corridor from the southern suburbs of Washington, DC north through Baltimore, Philadelphia, and New York to Boston (see Figure 4.10). It covers about 2 percent of the land area in the United States but is home to over 50 million people, around 16 percent of the US population. It is projected to grow to 58 million people by 2025. The Northeast Megalopolis is just one of many growing urban areas in North America. The Atlanta Metropolitan area may one day extend into Charlotte, North Carolina. Toronto’s urban development may creep south, intermixing with development in Detroit, Cleveland, and Chicago. Florida may one day become one megalopolis linking the cities of Tampa, Orlando, Miami, and Jacksonville. These massive urban settlements will provide new opportunities for creative housing and transportation planning.
One creative approach to the problem of urban sprawl is New Urbanism, a movement to create urban landscapes with walkable neighborhoods, accessible public spaces, and housing and shops in close proximity. In the United States alone, more than 600 towns and villages have been developed following the New Urbanist principles. Celebration, Florida, for example, near Orlando was designed and built by the Walt Disney Company and includes a variety of apartments and single-family homes in close proximity to shops, restaurants, and a movie theater – all of which are in walking distance for residents (see Figure 4.11). In other areas, New Urbanism is more broadly integrated into long-term urban plans. One criticism of New Urbanist developments is that while on the surface, they promote mixed income developments, in practice most housing in these areas are for the middle and upper classes. Housing prices in these developments are simply beyond the reach of many low income families.

As urban to suburban migration continued, some desired instead to move back from the sprawling suburbs to be closer to the amenities of the downtown area. This often led to gentrification, where increased property values displace lower-income families and small businesses. Initially, low-income, historic housing near the city center attracted middle- and upper-income families. As these families moved in and renovated the housing, other families did the same. Over time, this renovation increased property values – an advantage for city officials who saw an increase in property tax revenue. For the poorest in the communities, however, this increase in property values often meant that they could no longer afford to rent near the central city. Given the auto-dependency of the sprawling suburbs, where would someone live if they had no transportation and worked in the downtown area? The walkability of the downtown, an amenity for those relocating from the suburbs, was often a necessity for low-income workers.
Gentrification also changes the racial and ethnic makeup of neighborhoods, as most people moving into these changing urban areas are typically white. The Bedford- Stuyvesant area of Brooklyn, for example, was traditionally an African American community but beginning in the 2000s, began to experience gentrification (see Figure
4.12). The percentage of white residents increased from 2.4 percent in 2000 to 22 percent in 2013. Median home prices jumped, too, from $400,000 in 2011 to $765,000
in 2016. New businesses have located in the area and the gentrification has funded major infrastructure improvements. For the neighborhood’s poorest residents, however, these improvements have pushed housing and rent prices beyond what they can afford.

(© Mark Hogan, Flickr, CC BY-SA 2.0)
4.5 Patterns of Inequality in North America
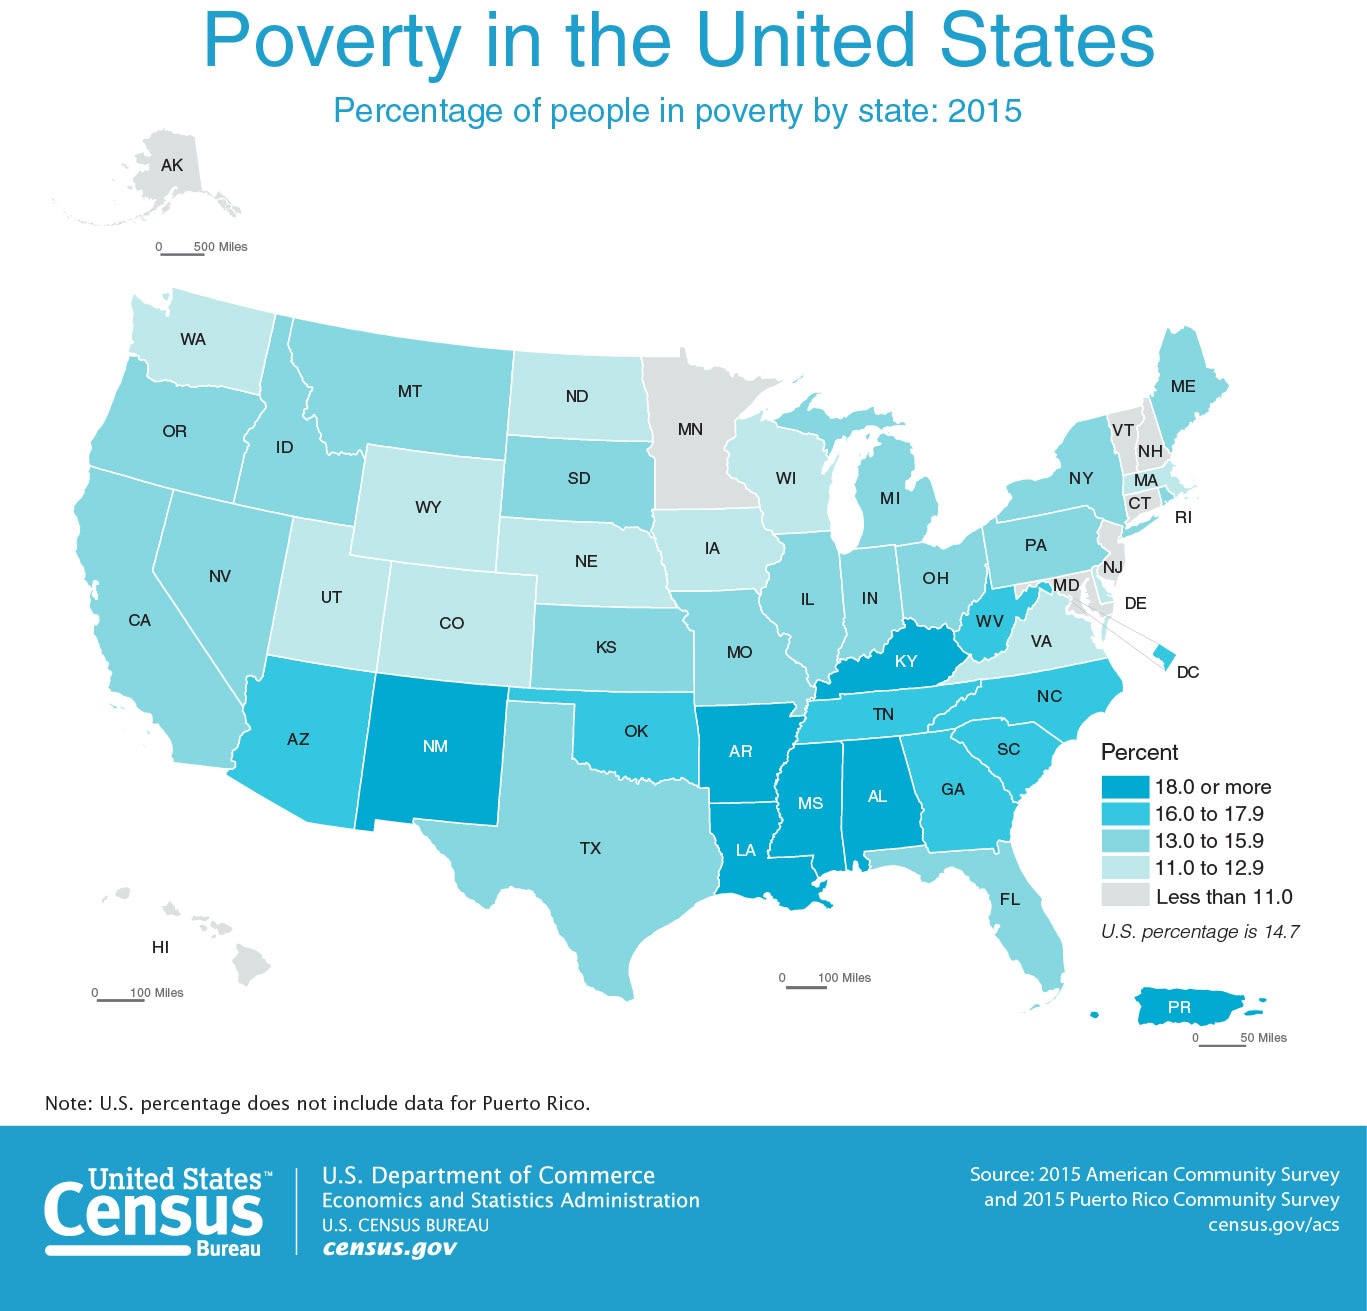
While both Canada and the United States have relatively strong economies, income inequality persists. In the United States in particular, around 12 percent of people live below the poverty line. Some argue, however, that the traditional definition of “living below the poverty line” has not kept up with rising living costs and inflation and that the actual percentage of Americans living in or near poverty is far higher. This income inequality is geographical, with the states in the south having significantly greater concentrations of people in poverty that the rest of the country (see Figure 4.13). These regional differences are connected to historical differences in development. Just as the northern areas were the first to industrialize, they were the first areas to transition to more higher-income service industries. Although areas like Silicon Valley in California and the Austin-San Antonio region of Texas have had an influx of high-tech industries, some areas of the south have been slow to transition from primarily agricultural and natural resource based economies.
Canada’s poverty rate is lower than the United States at around 10 percent. In general, Canada has stronger social welfare programs than the US. All provinces of Canada provide universal, publicly funded healthcare, for example, and a monthly income is provided to those in extreme poverty.
However, in both the United States and Canada, income inequality is closely tied to ethnicity and race. For Canada’s First Nations, however, poverty and homelessness rates are much higher than the national average. Half of all indigenous children in Canada live in poverty. In some areas, like Manitoba and Saskatchewan, the number is over 60 percent. In the US, the poverty rate among non-Hispanic whites was just over 10 percent in 2014. For black Americans, the poverty rate was 26 percent. By some measures, the US has the highest degree of income inequality among the advanced economies of the world. In Canada, the richest 10 percent own 57.4 percent of the country’s wealth. In the United States, the richest 10 percent own over 75 percent of the wealth in the country, the highest of the twenty most developed countries in the world.
4.6 North America’s Global Connections
North America continues to have a significant role in global trade and influence. Both Canada and the United States are members of the Group of Eight (G8), a political forum of the world’s leading industrialized countries that also includes France, Germany, Italy, Japan, Russia, the United Kingdom, and the European Union. Both are also members of the World Trade Organization (WTO), an intergovernmental organization that collectively regulates international trade (see Figure 4.14).

Within North America, trade has been governed under the North American Free Trade Agreement (NAFTA) between Canada, Mexico, and the United States. This agreement was established in 1994 with the goal of increasing economic cooperation between the three countries. Prior to NAFTA, although the US and Canada engaged in free trade, goods bought and sold between Mexico and the US were subject to tariffs, or additional taxes. In 2018, NAFTA was replaced by the United States–Mexico–Canada Agreement (USMCA) as a result of a renegotiation of NAFTA sought by US President Donald Trump.
NAFTA has had generally positive impacts on the economies of the region. Canada’s manufacturing output held steady despite global decreases in productivity. Mexico’s maquiladoras, manufacturing plants that take components of products and assemble them for export, have become a fixture of its landscape especially along the border. The United States also saw a modest economic boost from the agreement.
After the Cold War, the United States retained its position as a global superpower. It has the largest economy of any other country, including the combined output of the European Union, accounting for 25 percent of the world’s gross domestic product (GDP). It leads the world in military expenditures, and by many measures, is the most influential country in the world. However, it also has the largest prison population and has a much higher infant mortality rate than most other industrialized countries with strong regional concentrations of high infant mortality. Some wonder if the US will retain its global dominance in the coming decades, or if it will become one country among many influential world leaders.
Both Canada and the United States continue to attract immigrants, drawn to these countries by the hope of good jobs and political freedoms. Each country has dealt with the influx of immigration in very different ways. Over 200,000 people immigrate to Canada every year and the Canadian immigration system gives preference to immigrants for skilled professions. Around 20 percent of Canada’s population is foreign born, the highest of the G8 countries. Canada’s immigrants have shaped its cultural landscape and have created a rich cultural mosaic. In contrast, immigrants to the United States have generally been expected to assimilate, creating a relatively homogeneous cultural landscape rather than retaining individual ethnic identities. This notion of mixing cultural groups to create a more homogeneous national culture is metaphorically termed a melting pot.
Canada and the United States’ reactions to refugees have also been markedly different. The United States set a goal of accepting 10,000 Syrian refugees, but immigration from Syria has been contentious politically with some fearing the potential for terrorist attacks by migrants. Several state governors outright refused to accept Syrian refugees. The Canadian government, in contrast, agreed to resettle 25,000 Syrians in 2016. Canadian Prime Minister Justin Trudeau greeted the first plane of refugees, offering winter clothing and stuffed animals and saying, “Welcome home.” Throughout history, Canada has welcomed the world’s displaced peoples, accepting 1.2 million
refugees since World War II.
Undocumented, or illegal, immigration to the United States continues to be another significant political issue. Around 11 million undocumented migrants currently live in the US. Just over 50 percent are from Mexico. As drug crime worsened in Central America, undocumented migration from those countries surged and many now make a long and dangerous trek from Central America through Mexico in hope of reaching US soil. Undocumented and unaccompanied child migrants in particular have increased dramatically in recent years. As countries experience economic decline, political turmoil, and often dangerous living conditions, migrants will likely continue to flock to Canada and the US in search of a better life.
a cold biome characterized by coniferous trees, also known as taiga
an underground layer of permeable rock that holds groundwater
a type of agriculture looks at farming’s effect on the larger ecosystem and seeks to minimize negatively impacts on the ecosystem in the long-term
a form of acidic precipitation caused by the emission of sulfur dioxide and nitrogen oxide from the burning of fossil fuels
nonrenewable sources of energy formed by the remains of decayed plants or animals
the process of shifting from a primarily manufacturing-based economy to service industries
the central commercial and business area of a city, also known as the CBD
the expansion of human settlements away from central cities and into low-density, car-dependent communities
the spreading out of the population that resulted from suburbanization
a region of overlapping metropolitan areas
where increased property values resulting from the arrival of middle and upper class residents displace lower-income families and small businesses
a political forum of the world’s leading industrialized countries including Canada, France, Germany, Italy, Japan, Russia, the United Kingdom, the United States, and the European Union, also knwon as the G8
an intergovernmental organization that collectively regulates international trade, also known as the WTO
an agreement established in 1994 with the goal of increasing economic cooperation between Canada, Mexico, and the United States, also referred to as NAFTA
a manufacturing plant that takes components of products and assembles them for export
a metaphorical term referring to the mixing of cultural groups to create a more homogeneous national culture
