
7.3 Networks
Dyads, Triads, and Social Networks
A small group is typically one where the collection of people is small enough that all members of the group know each other and share simultaneous interaction, such as a nuclear family, a dyad, or a triad. Georg Simmel wrote extensively about the difference between a dyad, or two-member group, and a triad, a three-member group (Simmel, 1950 (1908)). No matter what the content of the groups is — business, friendship, family, teamwork, etc. — the dynamic or formal qualities of the groups differ simply by virtue of the number of individuals involved. The forms of sociation available to individuals differ significantly for dyads and triads, no matter the specific reason (content) for the sociation (e.g., friendship, love, business, leisure, etc.). The social dynamic inheres in the number of individuals, no matter who they are, how their backgrounds differ or what defines their specific interests. This insight forms the basis of the analysis of networks, which are another of the major meso-level social phenomena examined in sociology.
For example, in a dyad, if one person withdraws, the group can no longer exist. Examples include a divorce, which effectively ends the “group” of the married couple, or two best friends, who may never speak again. Neither of the two members can hide what they have done behind the group, nor hold the group responsible for what they have failed to do. A dyad is more precarious, but also more intimate, than a triad or larger networks.
In a triad the dynamic is quite different. If one person withdraws, the group lives on. A triad has a different set of relationships. If there are three in the group, two-against-one dynamics can develop and the potential exists for a majority opinion on any issue. At the same time, the relationships in a triad cannot be as close as in a dyad because a third person always intrudes. Whereas a group of two is both closer and more vulnerable than a group of three, because it rests on the immediate, ongoing reciprocity of the two members, a group of three is able to attain a sense of super-personal life and superordinate goals, independent of the members. There is a group “over and above” its members.
Exploring the difference between a dyad and a triad is an example of network analysis. A social network is a collection of people who exchange resources (emotional, informational, financial, etc.) and who are tied together by a specific configuration of connections. They do not need to know each other or share a group identity, yet they are part of a collectivity that is more than the sum of its parts. They can be characterized by the number of people involved, as in the dyad and triad, but also in terms of the structure of their ties (who is connected to whom) and the functions of their ties (what resources flow across ties). The study of structures (network ties), functions (resources shared) and degree of contagion (the degree of transmissibility of a resource) are key to network analysis. The particular configurations of the connections determine how networks are able to do more things and different things than individuals acting on their own could. Networks have this effect, regardless of the content of the connections or specific persons involved.
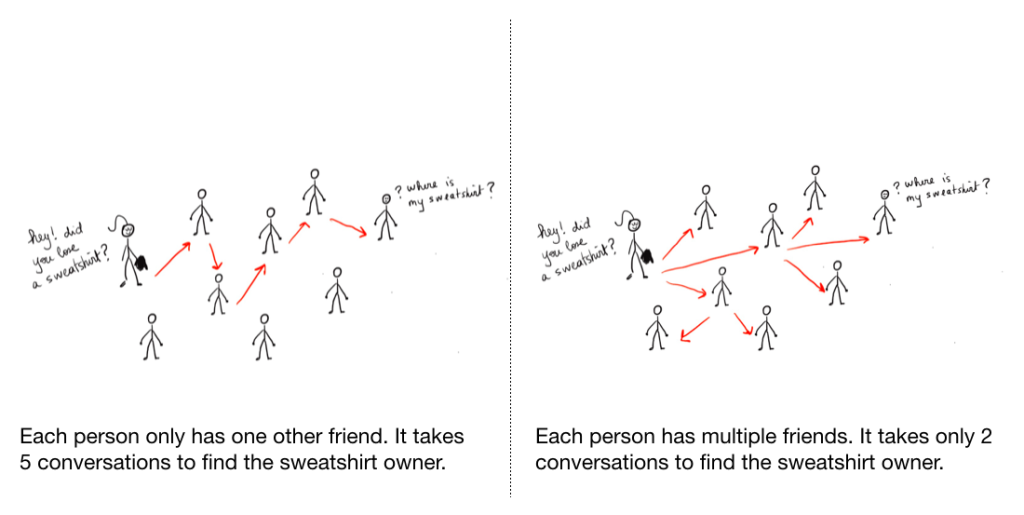
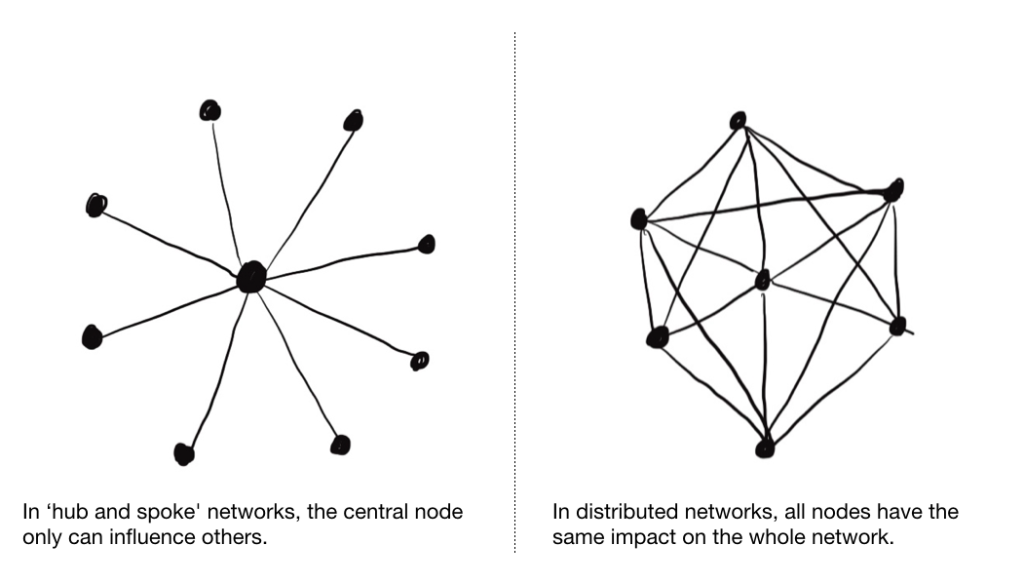
For example, if one person phones 50 people one after the other to see who could come out to play ball hockey on Wednesday night, it would take a long time to work through the phone list. This is an example of an inefficient network. The structure of the network would be one in which the telephone caller has an individual connection with each of the 50 players, but the players themselves do not necessarily have any connections with each other. There is only one node in the network: the telephone caller. This can be characterized as a “hub and spoke” structure (see Figure 7.18). On the other hand, if the telephone caller phones five key (or nodal) individuals, who would then call five individuals, and so on, then the telephone calling would be accomplished much more quickly. A telephone tree like this has a different network structure than the single telephone caller model does and can therefore accomplish the task much more efficiently and quickly (see Figure 7.17). Of course the responsibility is also shared so there are more opportunities for the communication network to break down, (but not as many as in a “bucket brigade” model where the resource, in this case information, is passed from “hand to hand” or “ear to ear” in a linear sequence).
Network analysis is interesting because much of social life can be understood as operating outside of either formal organizations or traditional group structures. Social media like Twitter or Facebook connect people through networks. One’s posts are seen by friends, but also by friends of friends. The revolution in Tunisia in 2010–2011 was aided by social media networks, which were able to disseminate an accurate, or alternate, account of the events as they unfolded, even while the official media characterized the unrest as vandalism and terrorism (Zuckerman, 2011). On the other hand, military counterinsurgency strategies trace cell phone connections to model the networks of insurgents in asymmetrical or guerilla warfare. Increased densities of network connections indicate the centrality of key insurgents and the ability of insurgents to mount coordinated attacks (Department of the Army, 2006).
The amorphous and fluid nature of global capital and the formation of a global capitalist class consciousness can also be analyzed by mapping interlocking directorates; namely, the way social networks are established and institutionalized between banks, corporations and investment funds in different parts of the world through shared board members. Mapping interlocking directorates can describe shifts in the network of corporate, banking, investment/pension fund board members who sit on each other’s boards of directors. Over the period from 1970 to 2010 for example, network analysis reveals the break up of national-based corporate elite networks, and the establishment of a unified and coordinated transatlantic capitalist class, which corresponds to the shift from national economies to late capitalism: globalized capital accumulation, neoliberal policies of deregulation and increasing economic inequality (Carroll, 2010).
Christakis and Fowler (2009) argue that social networks are influential in a wide range of social aspects of life, including political opinions, weight gain, and happiness. They develop Stanley Milgram’s claim that there is on average only six degrees of separation between any two individuals on Earth by adding that in a network there are also three degrees of influence. Milgram showed that if a friend represents one degree of separation, and a friend’s friend two degrees of separation, etc. then, on average, there are only six degrees of separation between any two people on earth. Three degrees of influence means that one is not only influenced by one’s immediate friends and social contacts, but by their friends, and their friends’ friends. For example, an individual’s chance of becoming obese increases 57% if a friend becomes obese; it increases by 20% if it is a friend’s friend who becomes obese; and it increases 10% if it is a friend’s friend’s friend who becomes obese. Beyond the third degree of separation, there is no measurable influence.
Making Connections: Sociology in the Real World
The COVID-19 Pandemic and Social Network Analysis: Super-Spreader Events, Global Networks, and Social Bubbles
The COVID-19 Pandemic is a perfect example of a 21st century, global social network phenomenon. The first confirmed infections were recorded in Wuhan, China, in December, 2019, and by March 11, 2020 the World Health Organization declared COVID-19 to be a global pandemic: “an epidemic occurring worldwide, or over a very wide area, crossing international boundaries and usually affecting a large number of people” (Last, 2001). As the virus spreads through respiratory droplets and airborne transmission in close face-to-face interactions, with an incubation period of 1–14 days (Prather et al., 2020), on its own, the virus does not travel far. Its spread from local outbreak in Wuhan to global pandemic depended on the structure of social connections that link people into a global network of COVID-19 transmission.
Two factors determine the spread of infectious diseases: the biological characteristics of the virus, and the social network that defines the structure of contact between people (Jo et al., 2021). Humans are not just passive hosts for viruses. They are actively involved in creating social networks with others and, as a result, the spread of viruses is not random but to some degree socially predictable. The structure of social network ties affects the spread of infection. What is interesting from a social network analysis is that infection rates — the estimated number of new people each COVID-positive person will infect (Covid ActNow, 2022) — are not uniform across populations. Infection spreads unevenly in a population because of the structure of ties that link people’s social networks. From a social network perspective, the overall increase or decrease in infections per unit of time (i.e.,the “flatness” of the infection curve) is closely related to the number of network steps needed to connect nodes in a network (Block et al., 2020). The fewer the steps, the more contagious the network is. This has implications for developing effective social strategies to disrupt the transmission of contagious diseases.
Examples of the different types of influence social network structures had in the COVID-19 pandemic include the phenomenon of superspreader events, global transmission through the global tourism network, and the use of social bubbles as a public health measure to inhibit transmission.
Superspreader events — in which one person infects a disproportionate number of other individuals at one time — have been estimated to account for 80% of COVID infections (Lewis, 2021). These events involve prolonged and crowded indoor gatherings with poor ventilation, often exacerbated by activities such as singing and aerobic exercise. From a network analysis perspective, these events involve the convergence of individuals from physically distant, isolated social networks into a single, temporary, dense or distributed network, and then their subsequent dispersal back to their original social networks. Each person that attends becomes a potential vector for the virus from a central hub of contagion. The Pacific Dental Conference in Vancouver in 2020 is described as the first superspreader event in BC. Fifteen thousand people attended the event which generated at least 87 documented cases of COVID-19 and one death (Mackin, 2022). This probably underestimated the overall impact however. Lemieux et al. (2020) describe a two-day international business conference in Boston which directly infected 90 attendees and their close contacts, but using genome sequencing they estimate that approximately 20,000 infections in Boston and its surrounding areas could be traced back to the conference.
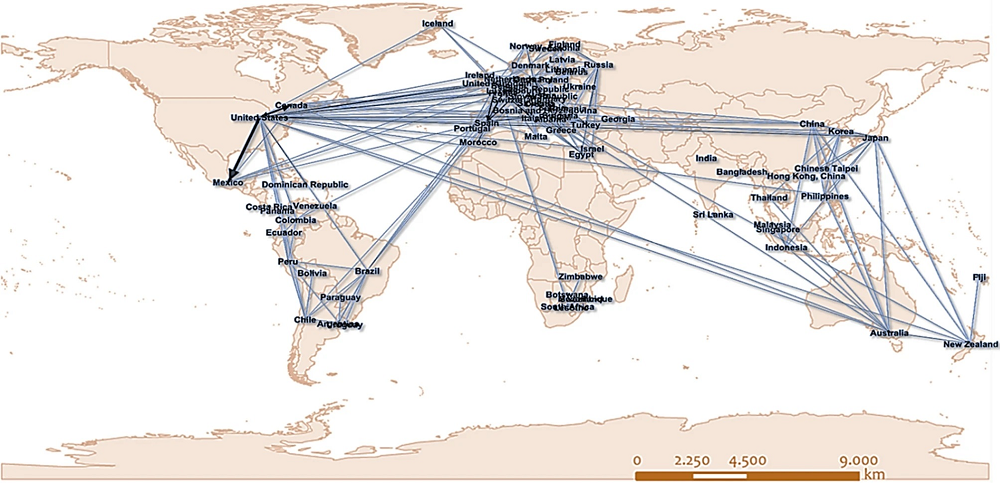
The rapid unfolding of the COVID-19 pandemic also exemplifies the properties of social networks. The “small world phenomenon” is a product of Merton’s 6 degrees of separation, where every element of the global network seems surprisingly “close” to almost every other element, even when they are geographically far away (Watts, 1999). People often say, “it is such a small world.” This is true but perhaps misrepresents how the global spread of COVID-19 was unevenly distributed due to the structure of pre-existing global networks. In other words, not every place on earth is equally connected through global networks. The virus spread firstly through networks of global tourism (Tsiotas & Tselios, 2022). Figure 7.19 shows the highly connected nodes or major tourist destinations and transfer points in the global tourism network. These were infected earlier by the pandemic than the other nodes. Tsiotas & Tselios (2022) describe the spread of the pandemic through time in three sequential clusters defined by their relative centrality to Wuhan and to the global tourism network: Firstly China, countries neighboring China, North America, Australia, and Western Europe; secondly less well tourism connected countries in Europe and the Americas; thirdly, South America, Southern Africa, Indonesia, Central Europe, Western Mediterranean basin and Turkey.
The concept of creating social bubbles was a public health measure deployed in a variety of jurisdictions to inhibit the spread of COVID-19 during the pandemic, especially prior to the introduction of vaccines. They are in a sense the opposite of superspreader events. The idea of a social bubble is to combine 2 or possibly 3 households in a single closeknit network detached as much as possible from the rest of society. This measure provides the benefit of breaking trains of transmission through social distancing while reducing the negative impacts of isolation such as loneliness, social isolation, lack of physical and emotional support and reduced childcare help. In terms of the goal of “flattening the curve” or reducing the impact on the health care system, modelling shows that social bubbles delay the peak of infections by 37%, (i.e.,the onset of peak infection numbers), decrease the height of the peak by 60%, (i.e.,the number of infected individuals), and results in 30% fewer infected individuals at the end of the simulation (Block et al., 2020).
Media Attribution
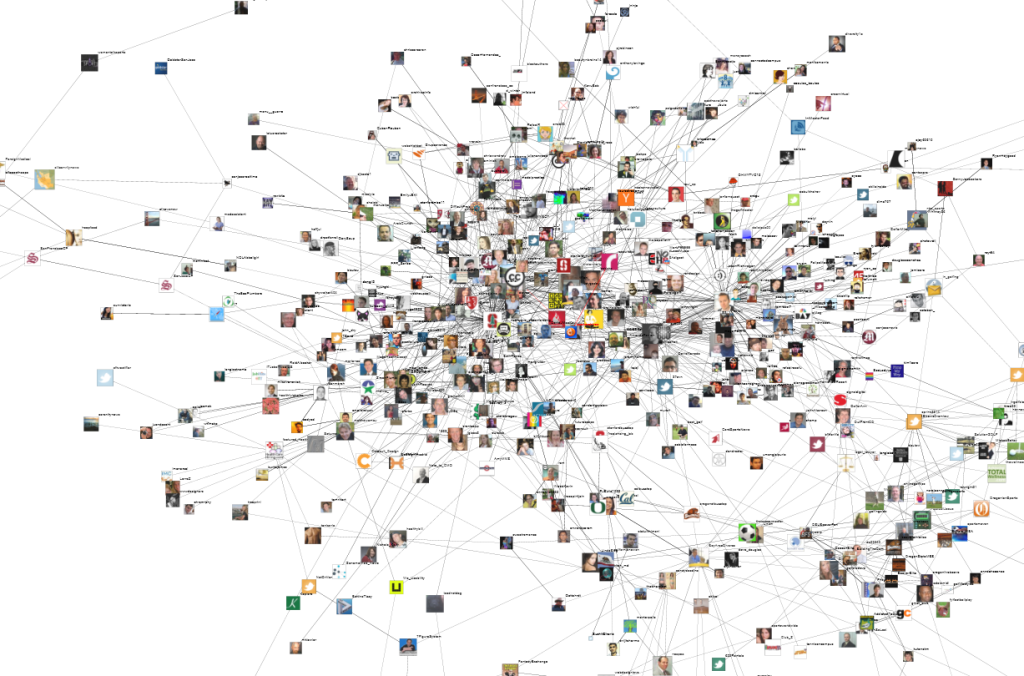
- Figure 7.16 Twitter Network Visualizations: “Stanford” by Marc Smith, via Flickr, is used under a CC BY 2.0 licence.
- Figure 7.17 Information spread in networks by Melusine Boon Falleur, via Wikimedia Commons, is used under a CC BY-SA 4.0 licence.
- Figure 7.18 Different shape networks by Melusine Boon Falleur, via Wikimedia Commons, is used under a CC BY-SA 4.0 licence.
- Figure 7.19 The graph model of the directed GTN by Tsiotas & Tselios (2022), via Springer Nature Limited, is used under a CC BY 4.0 International licence. [The graph model of the directed GTN (data of the year 2018, own elaboration based on ESRI ArcGIS 10.50; https://www.arcgis.com).]
