
5.4 Types of Unemployment
Below, we will look at some graphs that show the labour market indicators:
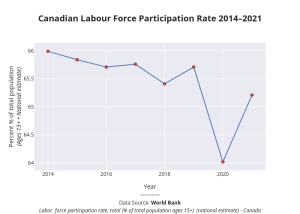
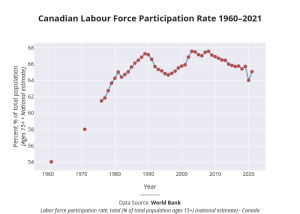
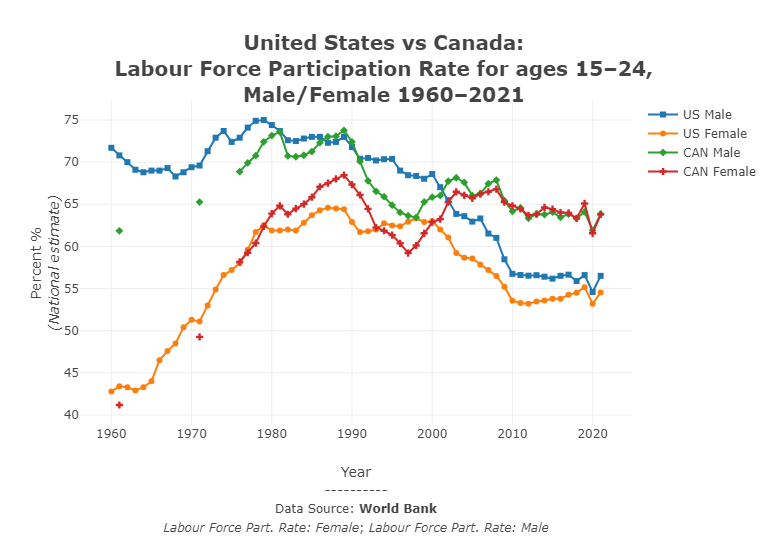
Figure 5.3 Canada Labour Force Participation 1960 – 2021[1][figure long description]
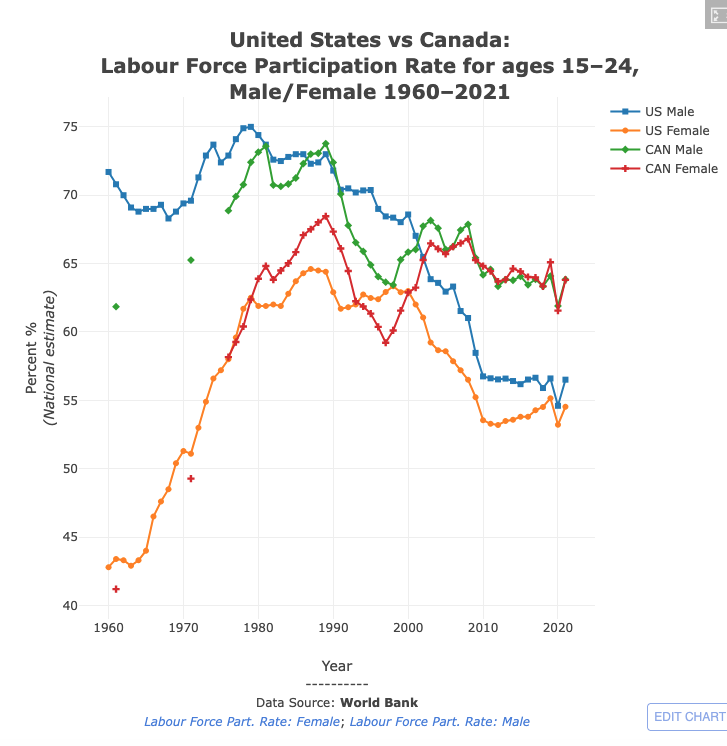
In figure 5.4, the patterns for women show notable differences from men in both the timing and the magnitude of the disparity in participation rates.
- The rate divergence between U.S. and Canadian prime-age women started in the mid-1990s.
- The emerging gap resulted from steady increases in labour force participation among Canadian women and steady declines in participation among U.S. women.
- In 1997, participation among women in the United States and Canada was nearly identical, close to 77%.
- By 2017, participation for Canadian women had risen to 83% while that for U.S. women had fallen to 75%, leaving an 8 percentage point gap.
- Three-fourths of the divergence in labour market participation rates of prime-age workers between the two countries is explained by the gap in the participation rates of women.[2]
Fig 5.6 Canada Unemployment Rate[3]
Current Canadian Rates
Current employment statistics (adjusted monthly) are available on the Statistics Canada website.
Workers may find themselves unemployed for different reasons. Each source of unemployment has quite different implications, not only for the workers it affects but also for public policy.
Frictional Unemployment

There’s always a situation where some workers are looking for jobs, and some employers are looking for workers. The workers remain unemployed during the time it takes to match them up. Unemployment that occurs because it takes time for employers and workers to find each other is called frictional unemployment.
The case of college graduates engaged in job searches is a good example of frictional unemployment. Those who did not land a job while still in school will seek work. Most of them will find jobs, but it will take time. During that time, these new graduates will be unemployed. If information about the labour market were costless, firms and potential workers would instantly know everything they needed to know about each other, and there would be no need for searches on the part of workers and firms. There would be no frictional unemployment. But information is costly. Job searches are needed to produce this information, and frictional unemployment exists while the searches continue. The frictional unemployment that results from people moving between jobs in a dynamic economy may account for one to two percentage points of total unemployment.
The government may attempt to reduce frictional unemployment by focusing on its source: information costs. Many provincial agencies, for example, offer job search assistance. They encourage firms seeking workers and workers seeking jobs to register with them. To the extent that such efforts make labour-market information more readily available, they reduce frictional unemployment.
Structural Unemployment
The structurally unemployed are individuals who have no jobs because they lack skills valued by the labour market, either because demand has shifted away from the skills they do have or because they never learned any skills. An example of the former would be the unemployment among aerospace engineers after the U.S. space program downsized in the 1970s. An example of the latter would be high school dropouts.
Some people worry that technology causes structural unemployment. In the past, new technologies have put lower-skilled employees out of work, but at the same time, they create demand for higher-skilled workers to use the new technologies. Education seems to be the key in minimizing the amount of structural unemployment. Individuals who have degrees can be retrained if they become structurally unemployed. That option is more limited for people with no skills and little education.
Structural unemployment can also result from geographical mismatches. Economic activity may be booming in one region and slumping in another. It will take time for unemployed workers to relocate and find new jobs. And poor or costly transportation may block some urban residents from obtaining jobs only a few miles away.
Public policy responses to structural unemployment generally focus on job training and education to equip workers with the skills firms demand. The government publishes regional labour-market information, helping to inform unemployed workers of where jobs can be found. Although government programs may reduce frictional and structural unemployment, they cannot eliminate it.
Cyclical Unemployment
The economy faces a boom and bust, which we call the business cycle. In certain periods, real GDP increases, and in other periods, real GDP decreases. You may recall from Chapter 4 that the increase in GDP is called economic expansion, and the decrease in GDP is called economic recession. Unemployment changes with changes in GDP. People will likely be laid off from jobs when the economy faces a recession. This triggers cyclical unemployment. Therefore, cyclical unemployment is a type of unemployment that changes with the business cycle. During a recession, cyclical unemployment increases, and cyclical unemployment decreases during the expansionary or recovery phase of the economy.
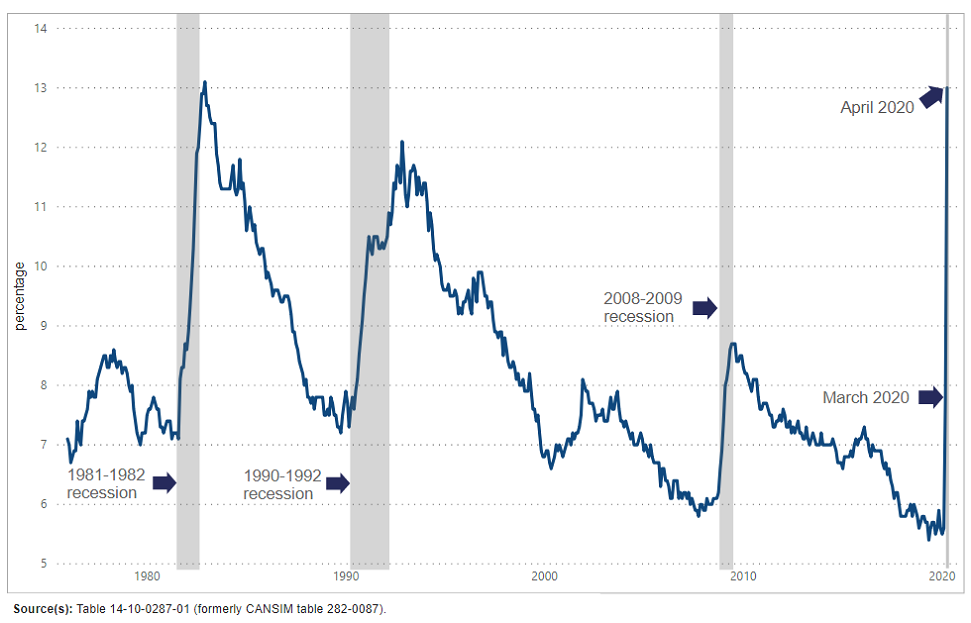
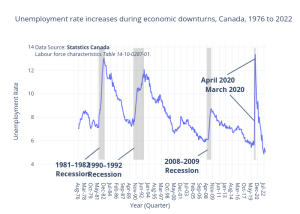
Fig 5.7 Unemployment rate increases during economic downturns, Canada, 1976 to 2022[4]
Seasonal Unemployment[5]
Seasonal unemployment may be seen as a kind of structural unemployment since it is a type of unemployment that is linked to certain kinds of jobs (construction work, migratory farm work, and fishing). The most-cited official unemployment measures erase this kind of unemployment from the statistics using “seasonal adjustment” techniques.
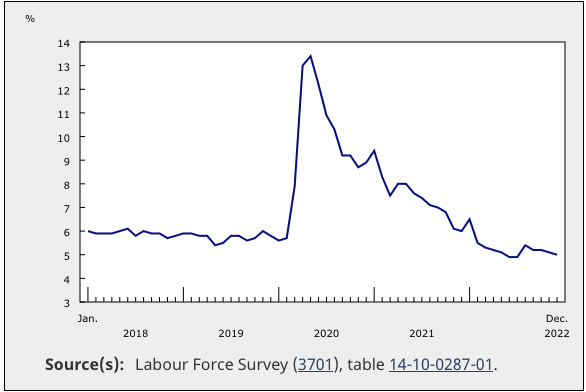
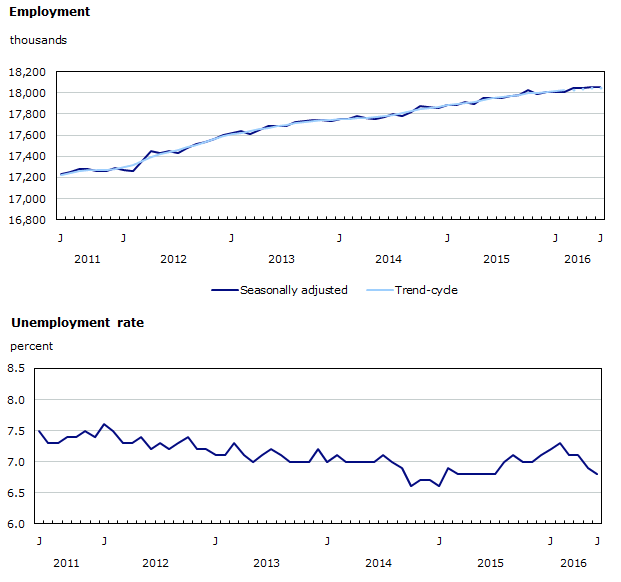
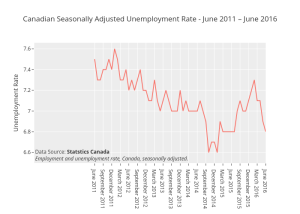
Figure 5.8 Seasonally Adjusted Unemployment Rate[6]
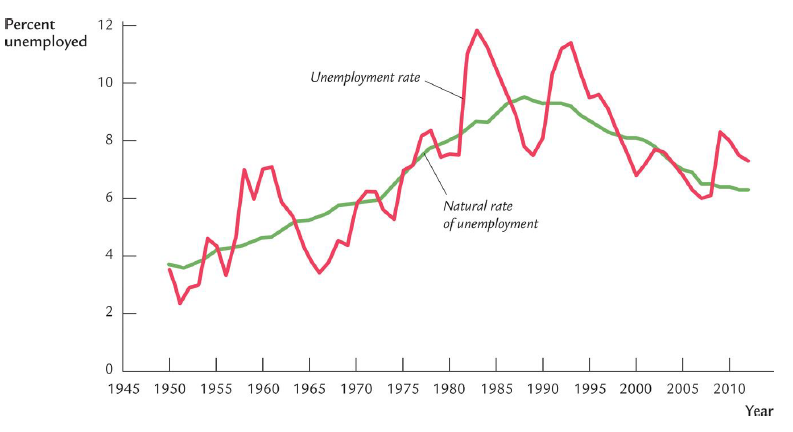
Natural Rate of Unemployment
When the aggregate economy faces only frictional and structural unemployment, we call that kind of unemployment the Natural Rate of Unemployment. When the economy operates at a Natural Rate of Unemployment, there is NO cyclical Unemployment; all the existing unemployment is only frictional and structural.
The natural unemployment rate is related to two other important concepts: full employment and potential real GDP. Economists consider the economy to be at full employment when the actual unemployment rate is equal to the natural unemployment rate. In other words, full employment implies a situation when the economy faces only frictional and structural unemployment. So, the economy operating at natural unemployment means the economy is at full employment. When the economy is at full employment, real GDP is equal to potential real GDP. By contrast, when the economy is below full employment, the unemployment rate is greater than the natural unemployment rate, and real GDP is less than the potential. Finally, when the economy is above full employment, the unemployment rate is less than the natural unemployment rate, and the real GDP is greater than the potential. Operating above potential is only possible briefly since it is analogous to all workers working overtime.
Attribution
Adapted from 5.3 Unemployment” from Principles of Macroeconomics by University of Minnesota is licensed under a CC BY-NC-SA 4.0 International Licence. Canadian content added.
- World Bank Group. (n.d.). Labor force participation rate, total (% of population ages 15+) national estimate Canada. https://data.worldbank.org/indicator/SL.TLF.CACT.NE.ZS?view=chart&locations=CA ↵
- Daly, M.C., Pedtke, J.H., Petrosky-Nadeau, N. & Schweinert, A. (2018, November 13). Why aren’t U.S. workers working? Federal Reserve Bank of San Francisco. Economic Letter. “https://www.frbsf.org/economic-research/publications/economic-letter/2018/november/why-are-us-workers-not-participating/. ↵
- Statistics Canada. (2022). Chart 3 Unemployment rate nears record low in Labour Force Survey, December 2022. The Daily. https://www150.statcan.gc.ca/n1/daily-quotidien/230106/cg-a003-eng.htm ↵
- Ibid ↵
- Ibid ↵
- Statistics Canada. (2016). Employment and unemployment rate, Canada, seasonally adjusted. https://www150.statcan.gc.ca/n1/pub/71-001-x/2016011/ct008-eng.htm ↵
