
23 Interpreting Point-of-Sale Information
Point-of-sale information is information that is gathered from your daily (or even hourly) receipts. Before computerized equipment was available, a supervisor would analyze the sales at the end of each day using the handwritten guest cheques. The total number of customers, the average cheque size, and the amounts of each entrée sold were tallied and recorded. The supervisor would also compute total sales, check cash against cash register totals, and complete other financial records. The information from the sales analysis was used by the chef or restaurant manager to manage inventory, predict volume of sales, and judge the popularity of items.
Types of Point-of-Sale Equipment
Today, most point-of-sales reports are generated automatically by point-of-sales (POS) hardware and software. A simple POS system may be a single cash register connected to a computer terminal that stores data, or it may be more complex with multiple terminals, handheld devices or tablets, and even smartphones connected to the system by supported applications, and also connected to printers at various points in the system that will print orders directly in the kitchen or bar area.
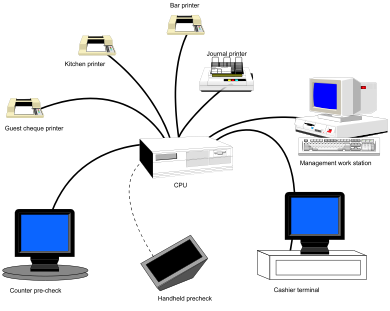
POS systems consist of a number of terminals connected to a central processing unit (Figure 38). For a terminal to process transactions, it must be connected to the central unit which houses the software and memory to process the information. Several types of terminals may be available. A pre-check terminal is used to enter orders; it has no cash drawer. Many pre-check terminals are now available in hand-held cordless models, or tablets or smartphones can be used for this purpose.
In some systems, a pre-check terminal is used to enter and print the orders for a table. The printed copy is then given to the kitchen to relay the order. In other systems, the order is sent directly from the pre-check machine to a printer in the kitchen or bar. The server does not have to carry the order over to the pickup counter.
A separate cashier terminal is used to settle guests’ cheques. The information may also be sent automatically to a journal printer and a manager workstation. The journal printer is usually located in a secure area and provides management with a detailed systems audit.
POS systems produce very detailed receipts (Figure 39). The wealth of information recorded by the machine allows much more detailed analysis of sales than was possible when guest cheques were handwritten.

POS information is a powerful tool that permits you to analyze menu performance and revise menus, forecast labour requirements, forecast inventory requirements, and analyze staff performance and sales. POS systems have the ability to generate
- Sales analysis reports
- Labour reports such as employee hours, wages, credits for meals, numbers of guests served per server, gross sales per server, average cheque size per server, and so forth
- Inventory files that can be used by inventory management software to automatically deduct items from inventory based on the standard recipe for a menu item
- Other management reports such as a daily revenue report
Sales Analysis Report
A sales analysis report analyzes sales by menu item. It can be computed for any period of time including an hour, a meal period (e.g., breakfast, lunch), a day, a week, or a month. The detailed reporting permits you to identify peak periods precisely. Fast-food restaurants will often want to analyze sales hourly to maximize the utilization of labour. The report includes:
- Number of items sold in each period
- Individual and total food cost for each menu item during the period (based on standard recipes and standard costs)
- Total food cost for the period (also called expected cost or ideal cost)
- Ideal food cost percentage
Ideal Food Cost
The ideal food cost is based on actual items sold. It is calculated by multiplying the actual number of items sold by the standard food cost per item, then summing the costs for all menu items. The ideal food cost is then compared to actual food costs. The standard recipe and standard cost must be regularly updated and recalculated for the comparison to be valid. The two costs should be fairly close. Minor variations can be the result of special purchases of bulk items or the use of small quantities of some items that are not restocked on a weekly basis. Larger discrepancies may indicate waste due to spills and spoilage, pilferage, poor portion control, changes in quality and yield of stock (e.g., due to overcooking). Customer complaints can result in an item being discarded without being charged or a second item being cooked.
Example
Menu Analysis and Engineering
Sales analysis reports provide detailed information that can be very helpful in menu planning. The reports can analyze the profitability and popularity of each item. You can then use the results to review the menu and make changes. Refer to the section of this book on menu engineering for more detail on how to use this information.
Forecasting Inventory Requirements
POS information can also be used to forecast inventory and staff requirements. If you have sales records that indicate that in a typical week you sell 84 portions of salmon and 97 portions of sirloin steak, you can look at your current inventory and decide how much you need to order for the coming week. Figure 40 illustrates this scenario.
| Menu Item | Monday | Tuesday | Wednesday | Thursday | Friday | Saturday | Sunday | Total | % Mix |
|---|---|---|---|---|---|---|---|---|---|
| Italian pizza | 7 | 9 | 10 | 10 | 25 | 22 | 17 | 100 | 11.90% |
| Cajun chicken | 8 | 9 | 9 | 12 | 10 | 13 | 12 | 73 | 8.69% |
| Sirloin steak | 5 | 8 | 6 | 8 | 27 | 25 | 18 | 97 | 11.55% |
| Chicken stir fry | 10 | 7 | 9 | 6 | 10 | 15 | 11 | 68 | 8.10% |
| Prawn stir fry | 5 | 5 | 6 | 11 | 8 | 8 | 6 | 49 | 5.83% |
| Linguine | 9 | 9 | 9 | 16 | 8 | 11 | 12 | 74 | 8.81% |
| Linguine chicken | 12 | 19 | 13 | 8 | 15 | 10 | 17 | 93 | 11.07% |
| Fettuccine alfredo | 11 | 13 | 12 | 18 | 16 | 19 | 22 | 111 | 13.21% |
| Salmon | 4 | 16 | 13 | 5 | 18 | 11 | 17 | 84 | 10.00% |
| BBQ chicken | 15 | 11 | 10 | 11 | 9 | 19 | 16 | 91 | 10.83% |
| Total | 81 | 106 | 97 | 106 | 146 | 153 | 147 | 840 | 100% |
If you have detailed reports that indicate the sales mix over the week, you can predict the required quantities of stock more precisely. In this example (Figure 40), the sales shown for the entire week are broken down into daily totals. If you look at the sales for sirloin steak, you will notice that they are not evenly spread throughout the week. If you have a delivery on Friday that must last you until Monday, you must have at least 70 steaks on hand to last you through the weekend.
Forecasting Staffing Requirements
If you have detailed reports that indicate levels of sales by hour, meal period, and day, you will be able to identify peak days and times more easily. Figure 41 shows an example.
| Meal Period | Mon | Tues | Wed | Thu | Fri | Sat | Sun |
|---|---|---|---|---|---|---|---|
| 5:00-6:00 | 56 | 72 | 48 | 54 | 53 | 119 | 123 |
| 6:00-7:00 | 94 | 156 | 117 | 119 | 94 | 121 | 131 |
| 7:00-8:00 | 145 | 183 | 156 | 173 | 156 | 163 | 165 |
| 8 :00-9:00 | 89 | 87 | 101 | 115 | 203 | 207 | 177 |
| 9:00-10:00 | 73 | 66 | 54 | 78 | 177 | 177 | 96 |
| 10:00-11:00 | 45 | 42 | 47 | 37 | 72 | 74 | 45 |
| Total | 502 | 606 | 523 | 576 | 755 | 861 | 737 |
You need to schedule staff for the restaurant. You need to know what times are busiest and how much staffing you will need for each period. In Figure 41, you can see that Monday and Wednesday are your slowest days, while Friday and Saturday are the busiest. There is also a different pattern for the peak times on weekdays versus the weekend. On Saturday and Sunday nights, volume peaks later in the evening and the peak period is much longer. For example, on Wednesday the peak of 156 guests comes between 7:00 p.m. and 8:00 p.m., while on Saturday, the peak is between 8:00 p.m. and 9:00 p.m.
Historical data collected from month to month and year to year is useful for projecting trends and seasonal variations in sales and, therefore, staffing needs. It may also be used to determine whether the sales figures you had for last Tuesday show an unexplained blip, or whether indeed Tuesday is usually a better day for your restaurant than Monday or Wednesday.
Another use for historical data is to project sales for holidays and special occasions. For example, last year, you had 250 guests for brunch on Mother’s Day. If this year, your average sales are up 10%, you might conclude that you need to have sufficient staff to handle 275 guests.
Manage Staff
POS information can also be used to manage staff. The software will allow you to prepare reports that track the sales of each server. You might be able to determine the average cheque size of guests served by each server. You could also track the amount of alcohol, appetizer, and dessert sales to see whether your servers are suggestively selling these items. If you have an incentive program to sell specific menu items or specials, you could track the staff member’s performance. These reports may be used to give feedback to staff on their performance and suggest methods of improving their sales.
Summary
Overall, the POS system has become a very effective tool for the industry to collect and manage a wide array of information. The advantages that the technology has brought are in the rapid calculation and analysis of a large amount of data, but all of these systems still require those who operate them and interpret the data to have a solid understanding of the principles of effective kitchen management and cost controls.
