Regulation of Water Balance
As you eat a bite of food, the salivary glands secrete saliva. As the food enters your stomach, gastric juice is secreted. As it enters the small intestine, pancreatic juice is secreted. Each of these fluids contains a great deal of water. How is that water replaced in these organs? What happens to the water now in the intestines? In a day, there is an exchange of about 10 liters of water among the body’s organs. The osmoregulation of this exchange involves complex communication between the brain, kidneys, and endocrine system. A homeostatic goal for a cell, a tissue, an organ, and an entire organism is to balance water output with water input.
Regulation of Daily Water Input
Total water output per day averages 2.5 liters. This must be balanced with water input. Our tissues produce around 300 milliliters of water per day through metabolic processes. The remainder of water output must be balanced by drinking fluids and eating solid foods. The average fluid consumption per day is 1.5 liters, and water gained from solid foods approximates 700 milliliters.

Dietary Gain of Water
The Adequate Intake (AI) for water for adult males at 3.7 liters (15.6 cups) and at 2.7 liters (11 cups) for adult females.[1] These intakes are higher than the average intake of 2.2 liters. It is important to note that the AI for water includes water from all dietary sources; that is, water coming from food as well as beverages. People are not expected to consume 15.6 or 11 cups of pure water per day. Approximately 20 percent of dietary water comes from solid foods. See Table “Water Content in Foods” for the range of water contents for selected food items. Beverages includes water, tea, coffee, sodas, and juices.
| Percentage | Food Item |
| 90–99 | Nonfat milk, cantaloupe, strawberries, watermelon, lettuce, cabbage, celery, spinach, squash |
| 80–89 | Fruit juice, yogurt, apples, grapes, oranges, carrots, broccoli, pears, pineapple |
| 70–79 | Bananas, avocados, cottage cheese, ricotta cheese, baked potato, shrimp |
| 60–69 | Pasta, legumes, salmon, chicken breast |
| 50–59 | Ground beef, hot dogs, steak, feta cheese |
| 40–49 | Pizza |
| 30–39 | Cheddar cheese, bagels, bread |
| 20–29 | Pepperoni, cake, biscuits |
| 10–19 | Butter, margarine, raisins |
| 1–9 | Walnuts, dry-roasted peanuts, crackers, cereals, pretzels, peanut butter |
| 0 | Oils, sugars |
There is some debate over the amount of water required to maintain health because there is no consistent scientific evidence proving that drinking a particular amount of water improves health or reduces the risk of disease. In fact, kidney-stone prevention seems to be the only premise for water-consumption recommendations. You may be surprised to find out that the commonly held belief that people need to drink eight 8-ounce glasses of water per day isn’t an official recommendation and isn’t based on any scientific evidence! The amount of water/fluids a person should consume every day is actually variable and should be based on the climate a person lives in, as well as their age, physical activity level, and kidney function. No maximum for water intake has been set.
Thirst Mechanism: Why Do We Drink?
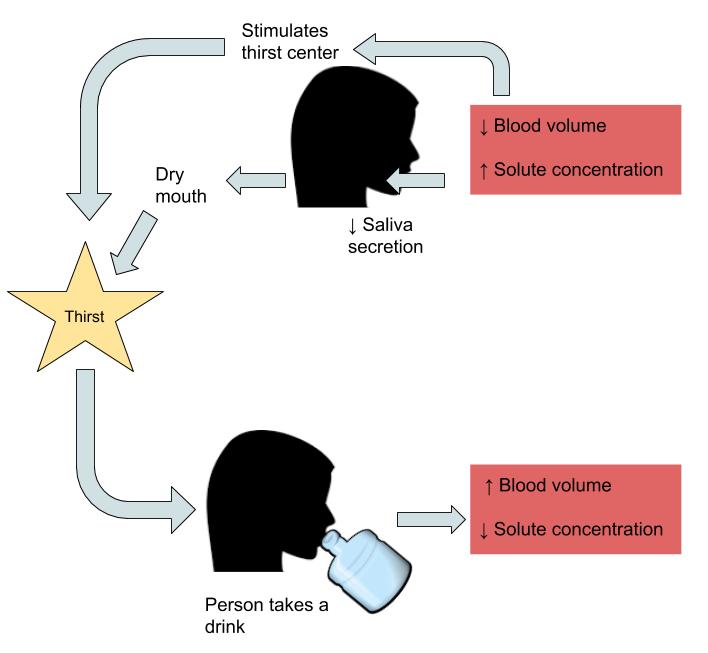
Thirst is an osmoregulatory mechanism to increase water input. The thirst mechanism is activated in response to changes in water volume in the blood, but is even more sensitive to changes in blood osmolality. Blood osmolality is primarily driven by the concentration of sodium cations. The urge to drink results from a complex interplay of hormones and neuronal responses that coordinate to increase water input and contribute toward fluid balance and composition in the body. The “thirst center” is contained within the hypothalamus, a portion of the brain that lies just above the brainstem. In older people the thirst mechanism is not as responsive and as we age there is a higher risk for dehydration. Thirst happens in the following sequence of physiological events:
- Receptor proteins in the kidney, heart, and hypothalamus detect decreased fluid volume or increased sodium concentration in the blood.
- Hormonal and neural messages are relayed to the brain’s thirst center in the hypothalamus.
The hypothalamus sends neural signals to higher sensory areas in the cortex of the brain, stimulating the conscious thought to drink. - Fluids are consumed.
- Receptors in the mouth and stomach detect mechanical movements involved with fluid ingestion.
- Neural signals are sent to the brain and the thirst mechanism is shut off.
The physiological control of thirst is the backup mechanism to increase water input. Fluid intake is controlled primarily by conscious eating and drinking habits dependent on social and cultural influences. For example, you might have a habit of drinking a glass of orange juice and eating a bowl of cereal every morning before school or work.

Regulation of Daily Water OutputAs stated, daily water output averages 2.5 liters. There are two types of outputs. The first type is insensible water loss, meaning we are unaware of it. The body loses about 400 milliliters of its daily water output through exhalation. Another 500 milliliters is lost through our skin. The second type of output is sensible water loss, meaning we are aware of it. Urine accounts for about 1,500 milliliters of water output, and feces account for roughly 100 milliliters of water output. Regulating urine output is a primary function of the kidneys, and involves communication with the brain and endocrine system.

The Kidneys Detect Blood Volume
The kidneys are two bean-shaped organs, each about the size of a fist and located on either side of the spine just below the rib cage. The kidneys filter about 190 liters of blood and produce (on average) 1.5 liters of urine per day. Urine is mostly water, but it also contains electrolytes and waste products, such as urea. The amount of water filtered from the blood and excreted as urine is dependent on the amount of water in, and the electrolyte composition in the blood.
Kidneys have protein sensors that detect blood volume from the pressure, or stretch, in the blood vessels of the kidneys. When blood volume is low, kidney cells detect decreased pressure and secrete the enzyme, renin. Renin travels in the blood and cleaves another protein into the active hormone, angiotensin. Angiotensin targets three different organs (the adrenal glands, the hypothalamus, and the muscle tissue surrounding the arteries) to rapidly restore blood volume and, consequently, pressure.
The Hypothalamus Detects Blood Osmolality
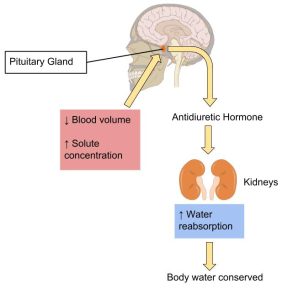
Sodium and fluid balance are intertwined. Osmoreceptors (specialized protein receptors) in the hypothalamus detect sodium concentration in the blood. In response to a high sodium level, the hypothalamus activates the thirst mechanism and concurrently stimulates the release of antidiuretic hormone. Thus, it is not only kidneys that stimulate antidiuretic- hormone release, but also the hypothalamus. This dual control of antidiuretic hormone release allows for the body to respond to both decreased blood volume and increased blood osmolality.
The Adrenal Glands Detect Blood Osmolality
Cells in the adrenal glands sense when sodium levels are low and potassium levels are high in the blood. In response to either stimulus, they release aldosterone. Aldosterone is released in response to angiotensin stimulation and is controlled by blood electrolyte concentrations. In either case, aldosterone communicates the same message, to increase sodium reabsorption and consequently water reabsorption. In exchange, for the reabsorption of sodium and water, potassium is excreted.
Chapter Attribution
Chapter 4.3 in Human Nutrition in a Canadian Context by Karine Hamm published by BCcampus in 2021 under a CC BY License.
- Institute of Medicine Panel on Dietary Reference Intakes for Electrolytes and Water. Dietary Reference Intakes for Water, Potassium, Sodium, Chloride, and Sulfate. The National Academies of Science, Engineering, and Medicine. Washington D.C; 2005: 73-185. http://www.nap.edu/openbook.php?record_id=10925&page=73. ↵
- Department of Agriculture, Agricultural Research Service. (2010). National Nutrient Database for Standard Reference, Release 23. http://www.ars.usda.gov/ba/bhnrc/ndl. ↵

