
4 Market Research
Learning Objectives
In this chapter, you will learn:
- Key concepts in conducting market research
- Several methods for conducting online research, including surveys, online focus groups and data sentiment analysis
- Possible problems and pitfalls to look out for when researching online
Introduction
The Internet is built for research. Whether it’s a consumer shopping around for prices, a researcher exploring a topic or a fan looking up their favourite band, the Internet has provided new ways for gathering and analysing data.
Customers are able to research companies and products easily, gathering information to compare prices and services with a few clicks. Customers are also able to share likes and dislikes easily, whether that information is shared with companies or with friends.
As a result, brands can study who their customers are, what they are interested in, how they feel about the brand and the best times and places to engage with them. Insights can be gathered from ongoing market research, making it possible to course correct and apply data-driven decision making. This chapter will focus on tools and methodologies for gathering useful data.
| Term | Definition |
|---|---|
| Bounce rate | The number of people who view one page and then leave a website without viewing any other pages. Data statistics and facts collected for analysis. |
| Data sentiment analysis |
The systematic analysis of subjective materials, such as survey responses or social media posts, in order to determine the attitude and intended emotional communication of the customer. |
| Focus group | A form of qualitative research where people are asked questions in an interactive group setting. From a marketing perspective, it is an important tool for acquiring feedback on new products and various topics. |
| Hypothesis | A supposition that is tested in relation to known facts; a proposition based on reason but not necessarily assumed to be true. |
| Listening lab | A testing environment where the researcher observes how a customer uses a website or product. |
| Observation/ online ethnography | When researchers immerse themselves in a particular environment in order to gather insights. |
| Primary research | The collection of data to present a new set of findings from original research. |
| Qualitative data |
Data that can be observed but not measured. Deals with descriptions. |
| Quantitative data |
Data that can be measured or defined. Deals with numbers. |
| Research community |
A community set up with the intention of being a source for research. |
| Research methodology |
Methods employed in research to reach results. |
| Sample size | The number of respondents in a sample of the population. |
| Secondary research |
The collection of existing research data. |
| Sentiment | The emotion attached to a particular mention which is positive, negative or neutral. |
| Statistically significant |
A sample that is big enough to represent valid conclusions. |
The Importance of Market Research
The modern world can feel unpredictable. It is increasingly difficult to keep up with trends, customer needs, popular opinions and competitors. So, how can you keep your brand and products relevant to ensure you are meeting your customers’ needs?
The answer is to conduct market research. Market research helps you make informed business decisions. It involves systematically gathering, recording and analysing data about customers, competitors and the market and turning this data into insight that can drive marketing strategies, product design and positioning and communications strategies.
Online market research is the process of using digital tools, data and connections to glean valuable insights about a brand’s target audience. In other words, it’s the process of learning about your audience by engaging and observing them online. Technology plays a key role in gathering data and connecting with research participants and can make the whole process quicker and easier to manage than traditional offline research methods.
Traditional and online market research have the same goals and underlying principles, but online market research has the benefit of using digital technology, which provides a range of benefits:
- The Internet is always on, meaning that data is readily available at any time.
- Many of the processes for finding, gathering and storing data can be automated. For example, you can get an automatic email alert if someone mentions your brand, or you can set up self-administered digital surveys.
- You have access to a large number of participants around the world at the click of a button. A lot of the information you will use is already being automatically collected, such as web analytics and social media data. All you need to do is access it.
People are often happy to share their own research, insights and methodologies online, so you can access this trove of resources to inform your own research.
Online market research can be much more cost effective and quick to set up than traditional research techniques.
There are many reasons why you should conduct regular market research.
- To gain insights into your consumers. This can include:
- What customers want and need from your brand
- What customers like and dislike about the brand
- Why customers buy the brand’s products or services
- Why potential customers might choose your brand over another
- Why (or why not) customers make repeat
- Understand the changes in your industry and business
- Discover new market trends on which you can capitalise
- Find new potential sales avenues, customers, products and more
- Find and engage new audiences
- Allow customers to help steer your business.
If you are able to understand your customers and the greater business context, you will be able to market more effectively, meet their needs better and drive more positive sentiment around your brand. All of this adds up to happier customers and, ultimately, a healthier bottom line.
Key Concepts in Market Research
While the research field can be full of complex terminology, there are four key concepts to understand before conducting your own research:
- Research methodology
- Qualitative and quantitative data
- Primary and secondary research
- Sampling.
Research Methodology
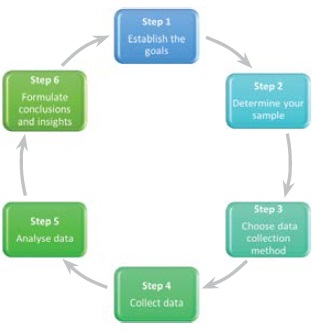
Research methodology refers to the process followed in order to conduct accurate and valuable research. The research process should involve certain steps:
- Establish the goals of the project
- Determine your sample
- Choose a data collection method
- Collect data
- Analyse the results
- Formulate conclusions and actionable insights (for example, producing reports).
Most often, market research is focused around specific issues unique to a business or brand. It is therefore not always possible to freely obtain comparable information to aid decision making. This is why it can be useful to start from a specific research problem or hypothesis when kicking off a research project. Your research question should guide your entire process and will determine your choice of data collection method. We will discuss more on those later.
Another approach involves ongoing data collection. As discussed in the Data-driven decision making chapter, unbiased decision making is far more accurately driven when aided by market insight. Many have argued that less expensive, ongoing data collection is increasingly a route proven to be useful to organisations.
Primary and Secondary Research
Research can be based on primary data or secondary data. Primary research is conducted when new data is gathered for a particular product or hypothesis. This is where information does not exist already or is not accessible and therefore, needs to be specifically collected from consumers or businesses. Surveys, focus groups, research panels and research communities can all be used when conducting primary market research.
Secondary research uses existing, published data as a source of information. It can be more cost-effective than conducting primary research. The Internet opens up a wealth of resources for conducting this research. The data could have originally been collected for solving problems other than the one at hand, so they may not be sufficiently specific. Secondary research can be useful for identifying problems to be investigated through primary research.
The Internet is a useful tool when conducting both primary and secondary research. Not only are there a number of free tools available when it comes to calculating things such as sample size and confidence levels (see section 4.7 on Tools of the trade for some examples), but it is also an ideal medium to reach large numbers of people at a relatively low cost.
The Internet and Secondary Research
Research based on secondary data should precede primary data research. It can be used in establishing the context and parameters for primary research.
Secondary data can:
- Provide enough information to solve the problem at hand, thereby negating the need for further research
- Provide sources for hypotheses that can be explored through primary research
- Provide information to inform primary research, such as sample sizes and audience
- Be used as a reference base to measure the accuracy of primary research.
Companies with online properties have access to an abundance of web analytics data that are recorded digitally. These data can then be mined for insights. It’s worth remembering, though, that it’s usually impossible for you to access the web analytics data of competitors. Therefore this method will give you information only about your own customers.
Customer communications are also a source of data that can be used, particularly communications with the customer service department. Committed customers who complain, comment or compliment are providing information that can form the foundation for researching customer satisfaction.
Social networks, blogs and other forms of social media have emerged as forums where consumers discuss their likes and dislikes. Customers can be particularly vocal about companies and products. This data can and should, be tracked and monitored to establish consumer sentiment. If a community is established for research purposes, the resulting feedback is considered primary data, but using social media to research existing sentiments is considered secondary research. The Internet is an ideal starting point for conducting secondary research based on published data and findings. With so much information out there, it can be a daunting task to find reliable resources.
The first point of call for research online is usually a search engine, such as Google or Yahoo Search engines usually have an array of advanced features, which can aid online research. For example, Google offers:
Many research publications are available online, some for free and some at a cost.
Many of the top research companies feature analyst blogs, which provide some industry data and analysis free of charge.
Some notable resources are:
The Internet and Primary Research
Primary research involves gathering data for a specific research task. It is based on data that has not been gathered beforehand. Primary research can be either qualitative or quantitative.
Primary research can be used to explore a market and can help to develop the hypotheses or research questions that must be answered by further research.
Generally, qualitative data is gathered at this stage. For example, online research communities can be used to identify consumer needs that are not being met and to brainstorm possible solutions. Further quantitative research can investigate what proportion of consumers share these problems and which potential solutions best meet those needs.
Quantitative and Qualitative Data
Data can be classified as qualitative or quantitative. Qualitative research is exploratory and seeks to find out what potential consumers think and feel about a given subject. Qualitative research aids in identifying potential hypotheses, whereas quantitative research puts hard numbers behind these hypotheses. Quantitative research relies on numerical data to demonstrate statistically significant outcomes.
The Internet can be used to gather both qualitative and quantitative data. In fact, the communities on the web can be viewed as large focus groups, regularly and willingly sharing their opinions about products, markets and companies.
In robust research studies, both qualitative and quantitative research can be applied at different stages of the study. The main differences between quantitative and qualitative research are represented in Table 2 below.
| Quantitative | Qualitative | |
|---|---|---|
| Data gathered | Numbers, figures, statistics objective data | Opinions, feelings, motivations, subjective data |
| Questions answered | What? | Why? |
| Group size | Large | Small |
| Data sources | Surveys, web analytics data | Focus groups, social media |
| Purpose | Tests known issues or hypotheses.
Seeks consensus, the norm Generalises data |
Generates ideas and concepts – leads to issues or hypotheses to be tested.
Seeks complexity Puts data in context |
| Advantages | Statistically reliable results to determine if one option is better than the alternatives | Looks at the context of issues and aims to understand perspectives. |
| Challenges | Issues can be measured only if they are known prior to starting.
Sample size must be sufficient for predicting the population |
Shouldn’t be used to evaluate pre-existing ideas.
Results are not predictors of the population. |
Both quantitative and qualitative research can be conducted online.
Web analytics packages are a prime source of data. Using data, such as search terms, referral URLs and internal search data, can lead to qualitative information about the consumers visiting a website. However, when data is measurable and specific, such as impressions and clickthrough rates, it leads to quantitative research.
Sampling
Qualitative research is usually conducted with a small number of respondents in order to explore and generate ideas and concepts. Quantitative research is conducted with far larger numbers, enough to be able to predict how the total population would respond.
You should ensure the sample is representative of the population you are targeting as a whole. If your business transacts both online and offline, be aware that using only online channels for market research might not represent your true target market. However, if your business transacts only online, offline channels for your market research are less necessary.
Because quantitative research aims to produce predictors for the total population, sample size is very important. The sample size needs to be sufficient in order to make statistically accurate observations about the population.
For example, if you have 4 000 registered users of your website, you don’t need to survey all of them in order to understand how the entire population behaves. You need to survey only 351 users to get a sample size that gives you a 95% confidence level with a ±5% confidence interval. This means that you can be 95% sure your results are accurate within ±5%.
There are several sample size calculators mentioned in section 4.7 on Tools of the trade.
Online Research Methodologies
There are many online market research methodologies. This chapter touches on three of the most popular and useful ones: surveys, online focus groups and social media monitoring.
Which methodology should you choose?
That all depends on a variety of factors, from your research question and purpose, to your budget and time. Here are some general pointers:
- Surveys: Ideal for collecting large amounts of quantitative data and some qualitative data. They are quick and easy to set up and can run automatically.
- Online focus groups: Ideal for engaging consumers and collecting qualitative data such as opinions, ideas and feelings about the brand. They require a larger time investment and a willing group of participants.
- Online monitoring: Ideal for collecting qualitative data on brand sentiment and can also provide some quantitative data around volume of interest in the brand. This data can be collected passively and there are several tools that can automate this.
Surveys
Surveys are questionnaires that contain a series of questions around a specific topic. Their purpose is to gather large volumes of quantitative data easily, though they can also collect some qualitative data.
Conducting surveys online allows for data to be captured immediately and data analysis can be performed easily and quickly. By using email or the Internet for conducting surveys, geographical limitations for collecting data can be overcome cost effectively.
Technology allows you to compile sophisticated and user-friendly surveys. For example, as opposed to indicating impressions on a sliding scale, respondents can indicate emotional response. Or the survey can be tailored depending on previous answers, such as questions being skipped if they are not relevant to the respondent.
You can run ongoing online surveys at minimal cost. Simple polls can be used in forums and on blogs to generate regular feedback. Website satisfaction surveys are also an easy way to determine the effectiveness of a website or marketing campaign.
One application of surveys is allows for instant feedback on questions or ideas from an existing community, such as a trusted group of thought leaders, your brand’s social media fans, or a pre-created research community. Examples include Facebook polling apps and real-time mobile survey platforms.
Designing Surveys
How you design a survey and its questions will directly impact on your success. A survey can include any number and type of questions and more complicated questions should appear only once users are comfortable with the survey. Be careful that you do not introduce bias when creating questions by asking leading questions.
Example
Incorrect: We have recently introduced new features on the website to become a first-class web destination. What are your thoughts on the new site?
Replace with: What are your thoughts on the changes to the website?
In general, you will also find that you get more accurate answers when phrasing questions in the past tense than in the continuous tense.
Example
Incorrect: How many times a week do you buy take-away food?
Replace with: In the past month, how many times did you buy take-away food?
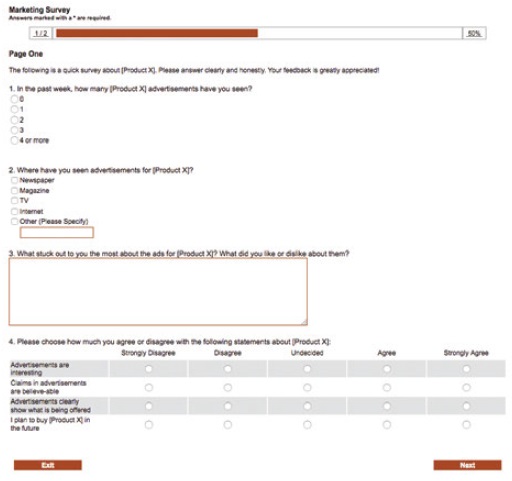
Types of Survey Questions
1. Open-ended
Open-ended questions allow respondents to answer in their own words. This usually results in qualitative data.
Example
What features would you like to see on the website for the digital marketing textbook (www.redandyellow.co.za/courses/textbook-digital/)?
2. Closed
Closed questions give respondents specific responses from which to choose. These are typically multiple-choice questions with either one or multiple possible answers. This results in quantitative data.
Example
Do you use the digital marketing textbook website? Yes
No
OR:
What features of the digital marketing textbook website do you use? Tick all that apply.
| Blog | Free downloads |
| Case studies | Additional resources |
3. Ranked or Ordinal
These types of questions ask respondents to rank items in order of preference or relevance. Respondents are given a numeric scale to indicate order. This results in quantitative data.
Example
Rate the features of the digital marketing textbook website, where 1 is the most useful and 4 is the least useful.
| Blog | Free downloads |
| Case studies | Additional resources |
4. Matrix and Rating
These types of questions can be used to quantify qualitative data. Respondents are asked to rank behaviour or attitude.
Example
Rate the features of the digital marketing textbook website according to the following scale:
1 = love it, 2 = like it, 3 = no opinion, 4 = dislike it.
| Blog | Free downloads |
| Case studies | Additional resources |
Focus Groups
Online focus groups involve respondents gathering online and reacting to a particular topic. Respondents can be sourced from all over the world and react in real time, arguably being freer with their responses since they can be anonymous in an electronic environment.
Online focus groups are ideal for having frank, detailed conversations with people who have an interest in your brand. This means they result in primary, qualitative data. This information can then be used to create quantitative research questions.
Online focus groups can be conducted using a range of technologies. The simplest is to use a text-based messaging program or online forum; there are many options available. More sophisticated tools allow for voice or video conferencing and can make it easier for the researcher to pick up clues from the respondent’s voice and facial expressions. Some tools allow the researcher to share their desktop screen with respondents in order to illustrate a concept or question.
Good options for conducting online focus groups include:

Focus groups are less formal than surveys, meaning the researcher will have specific questions to ask, but the conversation usually grows and develops organically as participants discuss their impressions. Usually running for between one and two hours, focus groups are used to get consumer views on:
- New products or marketing campaigns
- Existing products and campaigns and how they can be improved
- Sentiment around the brand
- Views on a brand’s new direction or visual style
- Ideas for how the brand could improve its position or branding.
Online focus groups are excellent for collecting a lot of qualitative data quickly. When setting up the group, try to include enough participants to keep the conversation alive, but not too many so that some get drowned out by others, eight to ten is a good range. Also consider that you may run into technical troubles if people are connecting from different locations and Internet connections. Be prepared to do some basic troubleshooting if this happens.
There are a number of different ways that you can recruit participants for an online focus group. This could include inviting people from your existing customer database, going through a traditional market research recruiting agent, or putting a call out on your website or social media communities. It is common practice to offer a small incentive to people who participate in a focus group, as it is a fairly time- intensive activity.
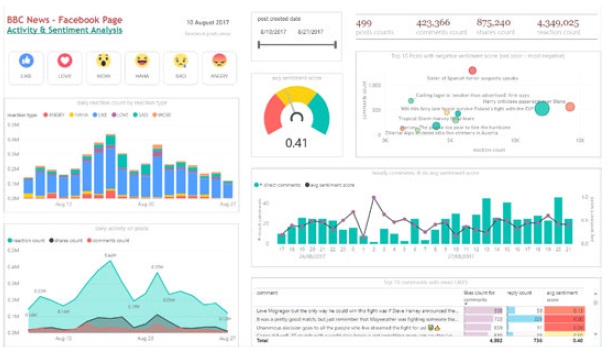
Sentiment Analysis
Finding out if people are talking about you is quite difficult in the offline world, but almost effortless online. Rather than having to conduct real-world surveys and interviews, in the digital world you can simply ‘listen’ to the conversation happening about you.
Keywords – the foundation to categorising and indexing the web – make it simple to track conversations taking place online. Customers don’t always use channels designated by a company to talk about that organisation, but the good news is that the Internet makes it easy for a company to identify and use the channels that customers have selected.
Online tools allow a company to track mentions of itself, its staff, its products, its industry and its competitors or anything else that is relevant. This is called online monitoring, online listening, or data sentiment analysis. It involves using digital tools to find and tap in to existing conversations. The tool then gathers and collates all the mentions it finds, so that you can analyse the data for insights.
Typically, searches include the following main focus areas:
- Company
- Brand name
- Key products
- Key personnel (names, job titles, etc.)
- Key campaigns and activities
- Industry
- Conferences
- Patents
- News
- Competitors
- Brand names
- Product launches
- Website updates
- Job vacancies
- Key people.
There are four different types of searches you can perform to track relevant brand keywords. Each modifies the specific type of data collected and aims to improve the quality and depth of the data you gather.
The four operators are:
- Broad match – for example, Apple Computers. This is when any of or all words must be found in the mention.
- Direct match – for example, “Apple Computers”. This is denoted by quotation marks and dictates that the tool should find mentions only where the phrase appears complete and in order in the content.
- Inclusive match – for example, Apple +computers. This is denoted by a plus sign directly before a word or phrase. This will direct the tool to search for any mention that contains both Apple AND computers, although not necessarily in that order.
- Exclusive match – for example, Apple –fruit. This is denoted by a minus sign directly before a word or phrase. This will instruct the tool to include only mentions that contain the first word or phrase but not when the second word is also in the same mention.
Combinations of these four types of searches (operators) can be used to improve accuracy.
Example
“Apple Computers” +”Steve Jobs”–fruit.
Applying this theory to the groupings above, some keywords used for Apple might be:
Company
- “Apple computers”
- “www.apple.com”
- Apple +Macbook, “iPod Nano”, “Macbook Air”, “iTunes” +music –radio
- “Steve Jobs”
Industry
- “Consumer Electronics Show” +“Las Vegas”
- “CEBIT”
Competitors
- Microsoft
- www.microsoft.com
It is also important to track common misspellings and typos, all related companies and all related websites.
Tracking the names of people key to a company can highlight potential brand attacks, or can demonstrate new areas of outreach for a company.
Brand names, employee names, product names and even competitor names are not unique. To save yourself from monitoring too much, identify keywords that will indicate that a post has nothing to do with your company and exclude those in your searches.
For example, “apple” could refer to a consumer electronics company, or it could appear in a post about the health benefits of fruit. Finding keywords that will indicate context can help to save time. So, you could exclusive-match words such as “fruit”, “tasty” and “granny smith”.
Tools for Data Sentiment Analysis
Thankfully, online listening does not entail hourly searches on your favourite search engine to see what conversations are taking place online. There are many different tools that monitor the web and supply the results via email alerts or a web dashboard.
Google has several bespoke search services and periodically adds more to the list.
- Google Alerts: Google Alerts will send an email when the keyword is used in either a credible news item or a blog post.
- Google News: Google News searches all news items for mentions of a keyword.
- Google Patent Search: Google Patent Search allows you to keep track of all filings related to an industry and searches can be done to see if there are patent filings which might infringe on other patents.
- Google Video Search: Google Video Search relies on the data that have been added to describe a video and will return results based on keyword matches.
In addition to these mostly free tools, there are also a number of premium paid tools available to make the process easier and more robust. See section 4.7 on Tools of the trade for more suggestions.
Other Avenues for Online Research
Personal Interviews
There are various tools available to the online researcher for conducting personal interviews, such as private chat rooms or video calling. The Internet can connect a researcher with many people around the world and make it possible to conduct interviews with more anonymity, should respondents require it.
Observation/online Ethnography
Taking its cue from offline ethnography, online ethnography requires researchers to immerse themselves in a particular environment. In this way insights can be gathered that might not have been attainable from a direct interview. However, they do depend more heavily on the ethnographer’s interpretation and are therefore subjective.
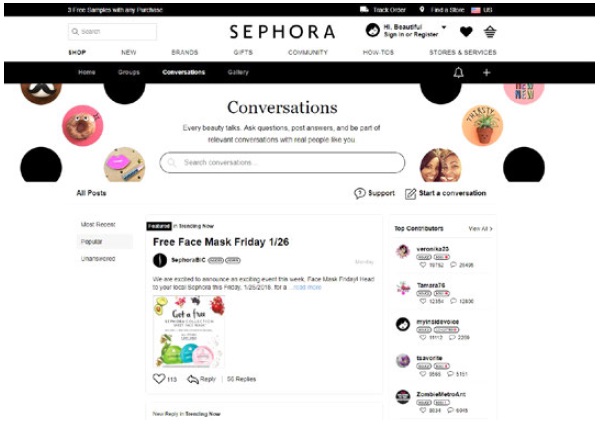
Online Research Communities
Although online communities are a valuable resource for secondary research, communities can also provide primary data. Sephora has an example of an online research community that helps gather research data. The community platform can be used as a means to elicit feedback about products and can generate ideas for new products. This is qualitative data that can aid the company in exploring their research problem further. In many cases, social media can be used to gather insight about a brand or customer experience. It is important to remember, however, that a representative sample is necessary for making solid conclusions.
Listening Labs
When developing websites and online applications, usability testing is a vital process that will ensure the website or application is able to meet consumers’ needs. Listening labs involve setting up a testing environment where a consumer is observed using a website or application.
Conversion Optimisation
Conversion optimisation aims to determine the factors of an advert, website or web page that can be improved in order to convert customers more effectively. From search adverts to email subject lines and shopping cart design, tests can be set up to determine what variables are affecting the conversion rate.
The Conversion optimisation chapter covers tools for running tests, such as A/B split testing and multivariate testing.
How to get responses: Incentives and assurances
As the researcher, you know what’s in it for you when sending out a survey. You will receive valuable insights that will aid in making business decisions. But what is in it for the respondents?
Response rates can be improved by offering respondents incentives for participating in the research, such as a chance to win a grand prize, a discount or special offer for every respondent, or even the knowledge that they are improving a product or service that they care about.
Some researchers feel that monetary incentives are not always a good thing. Some respondents may feel that they need to give ‘good’ or ‘correct’ answers that may bias results. Alternatively, you may attract respondents who are in it just for the reward. One approach could be to run the survey with no incentive, with the option of offering one if responses are limited.
Designing the survey to assure respondents that a minimal time commitment is required and their privacy is assured can also help to increase responses.
Room for Error
With all research there is a given amount of error to deal with. Bias may arise during surveys and focus groups, for example, interviewers leading the respondents. Or bias may be present in the design and wording of the questions themselves. There could be sample errors or respondent errors. Using the Internet to administer surveys removes the bias that may arise from an interviewer. However, with no interviewer to explain questions, there is potential for greater respondent error. This is why survey design is so important and why it is crucial to test and run pilots of surveys before going live.
Respondent errors also arise when respondents become too familiar with the survey process. The general industry standard is to limit respondents to being interviewed once every six months.
Sample error is a fact of market research. Some people are just not interested, nor will they ever be interested, in taking part in research. Are these people fundamentally different from those who do? Is there a way of finding out? To some extent, web analytics, which track the behaviour of all visitors to your website, can be useful in determining this.
When conducting online research, it is crucial to understand who is in the target market and what the best way to reach that target market is. Web surveys can exclude groups of people due to access or ability. It is vital to determine if is this is acceptable to the survey and to use other means of capturing data if not.
Justifying the cost of research
Regular research is an important part of any business’ growth strategy, but it can be tough to justify the budget necessary for research without knowing the benefit. Conducting research can cost little more than an employee’s work hours, depending on his or her skills, or it can be an expensive exercise involving external experts. Deciding where your business needs are on the investment scale depends on the depth of the research required and what the expected growth will be for the business. When embarking on a research initiative, the cost-to-benefit ratio should be determined.
Testing should be an ongoing feature of any digital marketing activity. Tracking is a characteristic of most digital marketing, which allows for constant testing of the most basic hypothesis: Is this campaign successful in reaching the goals of the business?
Tools of the trade
Creating and managing online surveys:
- SurveyMonkey
- Google Forms: accessed through Google Drive
- Split test calculator
- Sample size calculator:
- Internet Usage World Stats:
- Google Think
- Silverback usability testing software
- Mobile-based survey tools: (focused on the African continent), Survey Swipe
- Ideo Method Cards app (ideas for qualitative research):
- Premium online monitoring tools: BrandsEye, and SalesForce Marketing Clou
Advantages and challenges
Market researchers are increasingly turning to online tools in their research processes. The Internet allows for research at a far lower cost; it can also more easily cross geographic boundaries and can speed up the research process.
This is not to say there are not downsides. While the Internet makes it possible to reach a far larger group of people without the cost of facilitators, this does come with some challenges. For example, you cannot control the environments in which information is being gathered. For an online sample, it’s important to focus on getting the correct number of people to make your study statistically viable. If your questions are not carefully drafted, confusing questions could lead to answers that are flawed or not relevant. Additionally, online incentives could lead to answers that are not truthful, meaning that the value of the data could be questionable. Certain target groups are not accessible via the Internet and so it’s important that you carefully consider who you are trying to reach.
The value of Internet research should by no means be discounted, but it is important to consider the nature of the study carefully and to interrogate the validity and legitimacy of the data as a valid representation. Data is meaningful only if it is representative, so be sure to establish goals and realistic expectations for your research.
Case study: Sentiment data mining predicts political outcomes
One-line summary
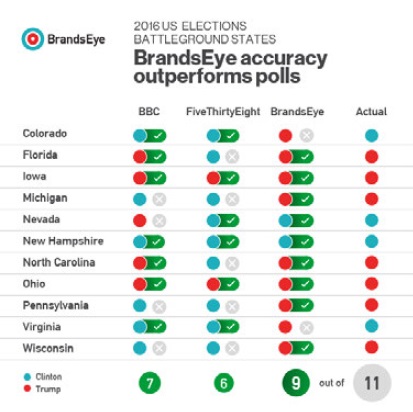
BrandsEye, is an opinion mining company based in South Africa that accurately predicted two significant political outcomes in 2016, outperforming traditional polling methods and showcasing the value of analysing social media analysis at scale.
The problem
The controversial referendum resulting in Britain leaving the European Union and the election victory for Republican nominee Donald Trump in the US presidential race in 2016, arguably came as surprises to the global community. This is largely due to the fact that the traditional polling methods used to predict the results of these separate national votes indicated that neither of these things would happen.
The Pew Research Centre listed a number of reasons for traditional polling methods falling short:
- Non-response bias: The sample population who took part in these polls were not representative of those who actually turned out to vote.
- Shy Trumper: Choosing to vote for Trump was not seen as socially desirable and so many would not admit to this in the poll.
- Failed voter turnout: Many people who planned to vote and stated their intentions in polls, did not in fact do so (Press 2016).
The solution
BrandsEye’s methodology, in both cases, accurately predicted the outcomes of these votes, because it relied on real-time organic conversations happening on multiple online platforms and used machine-learning and a crowd-sourcing approach to analyse the sentiment of the general conversation. Those who may have been reticent to take part in a poll, or to declare their political affiliations in official channels, did feel comfortable doing so on their own social media channels.
As explained on the BrandsEye website,
“…the traditional approach to social media analysis has been algorithmically driven, even though it is well known that machines fail to understand sarcasm and nuance, particularly in the social media context. With our unique crowd-sourcing approach to sentiment analysis, BrandsEye used people to understand the referendum commentary. Every online comment was independently analysed by several trained contributors to create a 95% confidence level with a 2.5% margin of error, an unheard of amount of precision in social media analysis”.[1]
The results
The results speak for themselves. In contrast to traditional polling, BrandsEye’s weighted average approach, matched the outcome of 9 of the 11 key swing states. As with Brexit, accurate social media analysis had once again proven to be the best way to understand the voice of the people. That voice is a human voice and BrandsEye’s use of trained humans to efficiently and effectively understand the sentiment of millions of citizens was the key to unlocking how they truly felt.
As the world becomes more connected, differences between decision makers and their stakeholders are becoming more visible and volatile than ever. Traditional methods of understanding a broad group of people are breaking down because they can neither measure the intensity nor the commitment of the emotions. Sophisticated analysis of social media, however, offers a more reliable understanding of what is happening in today’s world by combining world class tech and human understanding to provide a window into how people really feel and the factors driving that emotion.
The bigger picture
Understanding your market is the foundation of every marketing activity, online or off. If you don’t know who you’re speaking to, or what your audience cares about, it’s unlikely that your message will resonate with them.
Market research will define the content you create across channels like email marketing, digital copywriting, SEO and online advertising. It helps you find your audiences on social channels by indicating where they spend most of their time and how they like interacting with your brand. It also helps you meet their needs by defining the touchpoints they expect from your brand, especially when it comes to creating web and mobile channels.
The more data you can gather about your audience, the better you will be able to optimise and improve your marketing efforts. Market research is an excellent supplement to the quantitative data you can gather through data analytics.
Summary
Market research means gathering and analysing data in order to gain insight into consumers, understand a market and make business decisions. Information can be gathered about customers, competitors and the market.
Research can be conducted based on secondary data, which refers to information or data that is already published, or based on primary data, which is data gathered specifically for a particular research problem.
Research can also be qualitative or quantitative. The Internet provides the tools for gathering qualitative data, while online tools such as surveys and web analytics packages are ideal for gathering quantitative data.
Surveys, online focus groups and online monitoring are three excellent ways to conduct research online.
Analytics and online report tools play a big role in providing data. While these are digital marketing tactics in themselves and are covered later in this book, keep in mind that they also provide information that can feed into research conducted for a particular purpose.
Case Study Questions
- What is sentiment data?
- How could a tool like BrandsEye be used to gather information about your customers? Suggest some ideas.
- Why was BrandsEye able to correctly predict the results of the national referendum on Brexit and the US Presidential Elections?
Chapter Questions
- Discuss the relationship between the ideas discussed in the Data-driven decision making chapter and this one.
- What is primary research?
- What role does online research play in the overall market research toolkit?
Further Reading
Learn about probability sampling: Research Methods Knowledge Base by William M.K. Trochim on Conjoint.ly
References
BrandsEye., (2016) How BrandsEye Analysed the US Elections. [Online] Available at: www.brandseye.com/news/how-brandseye-analysed-the-us-elections[Accessed 30 October 2017]
Cnet, 2017. Google Hangout’s new features make work meetings slightly less annoying. [Online] Available at: www.cnet.com/news/google-hangouts-meet-chat[Accessed 30 October 2017]
Manufacturing control Tower (2017). Testbed Areas/Customer Sentiment Analysis. [Online] Available at: www.a-star.edu.sg/Portals/69/MCT/app-sentiment.html [Accessed 30 October 2017]
Press, E., (2016) Data-as-a-service Lessons from a Company That Was Right About Trump. [Online] Available at: dataconomy.com/2016/11/data-lessons-donald-trump[Accessed 30 October 2017]
Figure Acknowledgements
Figure 1. Own image
Figure 2. Screenshot, www.surveyexpression.com/Survey.aspx?id=ad3eb730-1d74-4e78-8d12-a3b7d52bfabf
Figure 3. Cnet, 2017. www.cnet.com/news/google-hangouts-meet-chat
Figure 4.Screenshot Sentiment analysis dashboard taken on 24 January 2018 app.powerbi.com/view?r=eyJrIjoiYjA1ZDNmYTctODE2OS00YTQ0LTliZDMtNzM5YzBmODk3NDQ5IiwidCI6ImI4ZGFiMmRlLWMzZWUtNDdmYS04NGIzLWVhNzE5OGUyOGFiZCIsImMiOjZ9
Figure 5. Sephora Community Screenshot, 24 Jan 2018. community.sephora.comFigure 6. Brandseye, 2016. www.brandseye.com/news/how-bra
- (N.A, 2016) ↵
