
Chapter 4. Food and Beverage Services
4.1 Food and Beverage Sector Performance
According to Statistics Canada, the food and beverage sector comprises “establishments primarily engaged in preparing meals, snacks and beverages, to customer order, for immediate consumption on and off the premises” (Government of Canada, 2012). This sector is commonly known to tourism professionals by its initials as F&B.
The food and beverage sector grew out of simple origins: as people travelled from their homes, going about their business, they often had a need or desire to eat or drink. Others were encouraged to meet this demand by supplying food and drink. As the interests of the public became more diverse, so too did the offerings of the food and beverage sector.
In 2018, Canadian food and beverage businesses accounted for 1.2 million employees and more than 97,000 locations across the country with an estimated $85 billion in sales, representing around 4% of the country’s overall economic activity. Many students are familiar with the sector through their workplace, because Canada’s restaurants provide one in every five youth jobs in the country — with 22% of Canadians starting their career in a restaurant or foodservice business. Furthermore, going out to a restaurant is the number one preferred activity for spending time with family and friends (Restaurants Canada, 2018a).
For a perspective on how sales are distributed across the country by province, and how different foodservice operations perform in terms of revenue (sales dollars collected from guests), look at Tables 4.1 and 4.2. A key factor in the below results is the higher population base in Ontario and Quebec. Economic growth or decline also impacts results and vary from province to province year over year.
In terms of sales (Table 4.2), Ontario is the leader with almost $28 billion. Quebec, BC, and Alberta occupy the next three spots with revenues ranging from $9 billion to $13 billion, and the other provinces had sales of $2 billion apiece or less. Over the last five years, BC has shown greater growth in revenues along with third more units (restaurants) than neighbouring Alberta, leading to identical average sales per unit.
Foodservice sales in British Columbia rose by a solid 7.9% in 2018 over 2017. Alberta boasts the highest average unit volume at $838,666 per year, more than $100,000 over the national average due to greater disposable income and no provincial sales tax on meals. In BC, improved economic growth lifted total foodservice sales by a healthy 7.9% for the strongest annual growth since 2006 (Restaurants Canada, 2019). Since 2018 Alberta has seen a significant decline in its economy due to the energy sector collapse tied to the price of crude oil.
| [Skip Table] | ||
| Province | Foodservice Units Totals | Average Volume/Unit ($) |
|---|---|---|
| Newfoundland and Labrador | 1,168 | 737,301 |
| Prince Edward Island | 413 | 663,259 |
| Nova Scotia | 2,260 | 750,458 |
| New Brunswick | 1,708 | 714,521 |
| Quebec | 22,736 | 594,147 |
| Ontario | 38,317 | 747,468 |
| Manitoba | 2,621 | 794,425 |
| Saskatchewan | 2,673 | 717,449 |
| Alberta | 11,277 | 838,666 |
| British Columbia | 14,550 | 838,444 |
| Canada | 97,939 | 735,915 |
| Data source: Statistics Canada, Restaurants Canada 2019 | ||
Table 4.2 below indicates the profit margins per province. Profit is the amount left when expenses (including corporate income tax) are subtracted from sales revenue. A higher profit margin means that a greater percentage of sales are retained by the business owner, and a lower percentage is lost to operating and other costs.
| [Skip Table] | ||||
| Province | Sales Growth | Sales | Pre-tax Profit Margin (% of operating revenue) | |
|---|---|---|---|---|
| 2018-19 Forecast (%) | 2018-17 Actual (%) | 2018 ($ millions) | ||
| Newfoundland and Labrador | 1.6% | .2% | $861.2 | 4.1% |
| Prince Edward Island | 4.3% | 6.3% | $273.9 | 6.9% |
| Nova Scotia | 3.9% | 5.6% | $1,696.0 | 5.0% |
| New Brunswick | 3.1% | 3.0% | $1,220.4 | 6.0% |
| Quebec | 4.2% | 5.2% | $13,508.5 | 4.4% |
| Ontario | 4.6% | 5.7% | $28,640.7 | 3.8% |
| Manitoba | 3.4% | 2.4% | $2,082.2 | 4.8% |
| Saskatchewan | 3.8% | 1.6% | $1,917.7 | 5.3% |
| Alberta | 3.0% | 2.4% | $9,457.6 | 4.4% |
| British Columbia | 4.8% | 7.9% | $12,199.4 | 4.7% |
| Canada | 4.2% | 5.2% | $72,074.8 | 4.3% |
| Data source: Statistics Canada, Restaurants Canada 2019 | ||||
The provincial variations in total sales and profit margins are due to several factors including:
- The relative level of economic activity
- Minimum wage levels, which have increased in several provinces
- Provincial sales taxes
- Cultural differences
- Weather
- Municipal taxes
- Percentage of the market held by chains versus independents
- Number of units (restaurants)
- The density of units relative to the local population
- Number of tourists or business travellers
Now that we have a sense of the relative performance of F&B operations by province, and some influences on success, let’s delve a little deeper into the sector.
Type of operation primarily engaged in preparing meals, snacks, and beverages, to customer order, for immediate consumption on and off the premises.
Travel by water is as old as civilization itself. However, the industry as we know it began when Thomas Newcomen invented the steam engine in 1712. The first crossing of the Atlantic by steam engine took place in 1819 aboard the SS Savannah, landing in Liverpool, England, after 29 days at sea. Forty years later, White Star Lines began building ocean liners including the Olympic-class ships (the Olympic, Britannic, and Titanic), expanding on previously utilitarian models by adding luxurious amenities (Briggs, 2008).
A boom in passenger ship travel toward the end of the 1800s was aided by a growing influx of immigrants from Europe to America, while more affluent passengers travelled by steamship for pleasure or business. The industry grew over time but, like rail travel, began to decline after the arrival of airlines. Shipping companies were forced to change their business model from pure transportation to "an experience," and the modern cruise industry was born.
The Cruise Sector
We've come a long way since the Olympic class of steamship. Today, the world's largest cruise ship, MS Oasis of the Seas, has an outdoor park with 12,000 plants, an 82-foot zip wire, and a high-diving performance venue. It's 20 storeys tall and can hold 5,606 passengers and a crew of up to 2,394 (Magrath, 2014). A crew on a cruise ship will include the captain, the chief officer (in charge of training and maintenance), staff captain, chief engineer, chief medical officer, and chief radio officer (communication, radar, and weather monitoring).
Spotlight On: Cruise Lines International Association
Cruise Lines International Association (CLIA) is the world's largest cruise industry trade association with representation in North and South America, Europe, Asia, and Australasia. CLIA represents the interests of cruise lines and travel agents in the development of policy. CLIA is also engaged in travel agent training, research, and marketing communications (CLIA, 2014). For more information on CLIA, the cruise industry, and member cruise lines and travel agencies, visit the Cruise Lines International Association website.
Cruising the World
According to CLIA, 30 million passengers were expected to travel worldwide on 63 member lines in 2019. Projections for 2020 were 32 million passengers expected to cruise (CLIA, 2020). Given increased demand, 24 new ships were expected in 2014–15, adding a total capacity of over 37,000 passengers.
Over 55% of the world's cruise passengers are from North America, and the leading destinations (based on ship deployments), according to CLIA, are:
- The Caribbean (37%)
- The Mediterranean (19%)
- Northern Europe (11%)
- Australia/New Zealand (6%)
- Alaska (5%)
- Asia (4%)
- South America (3%)
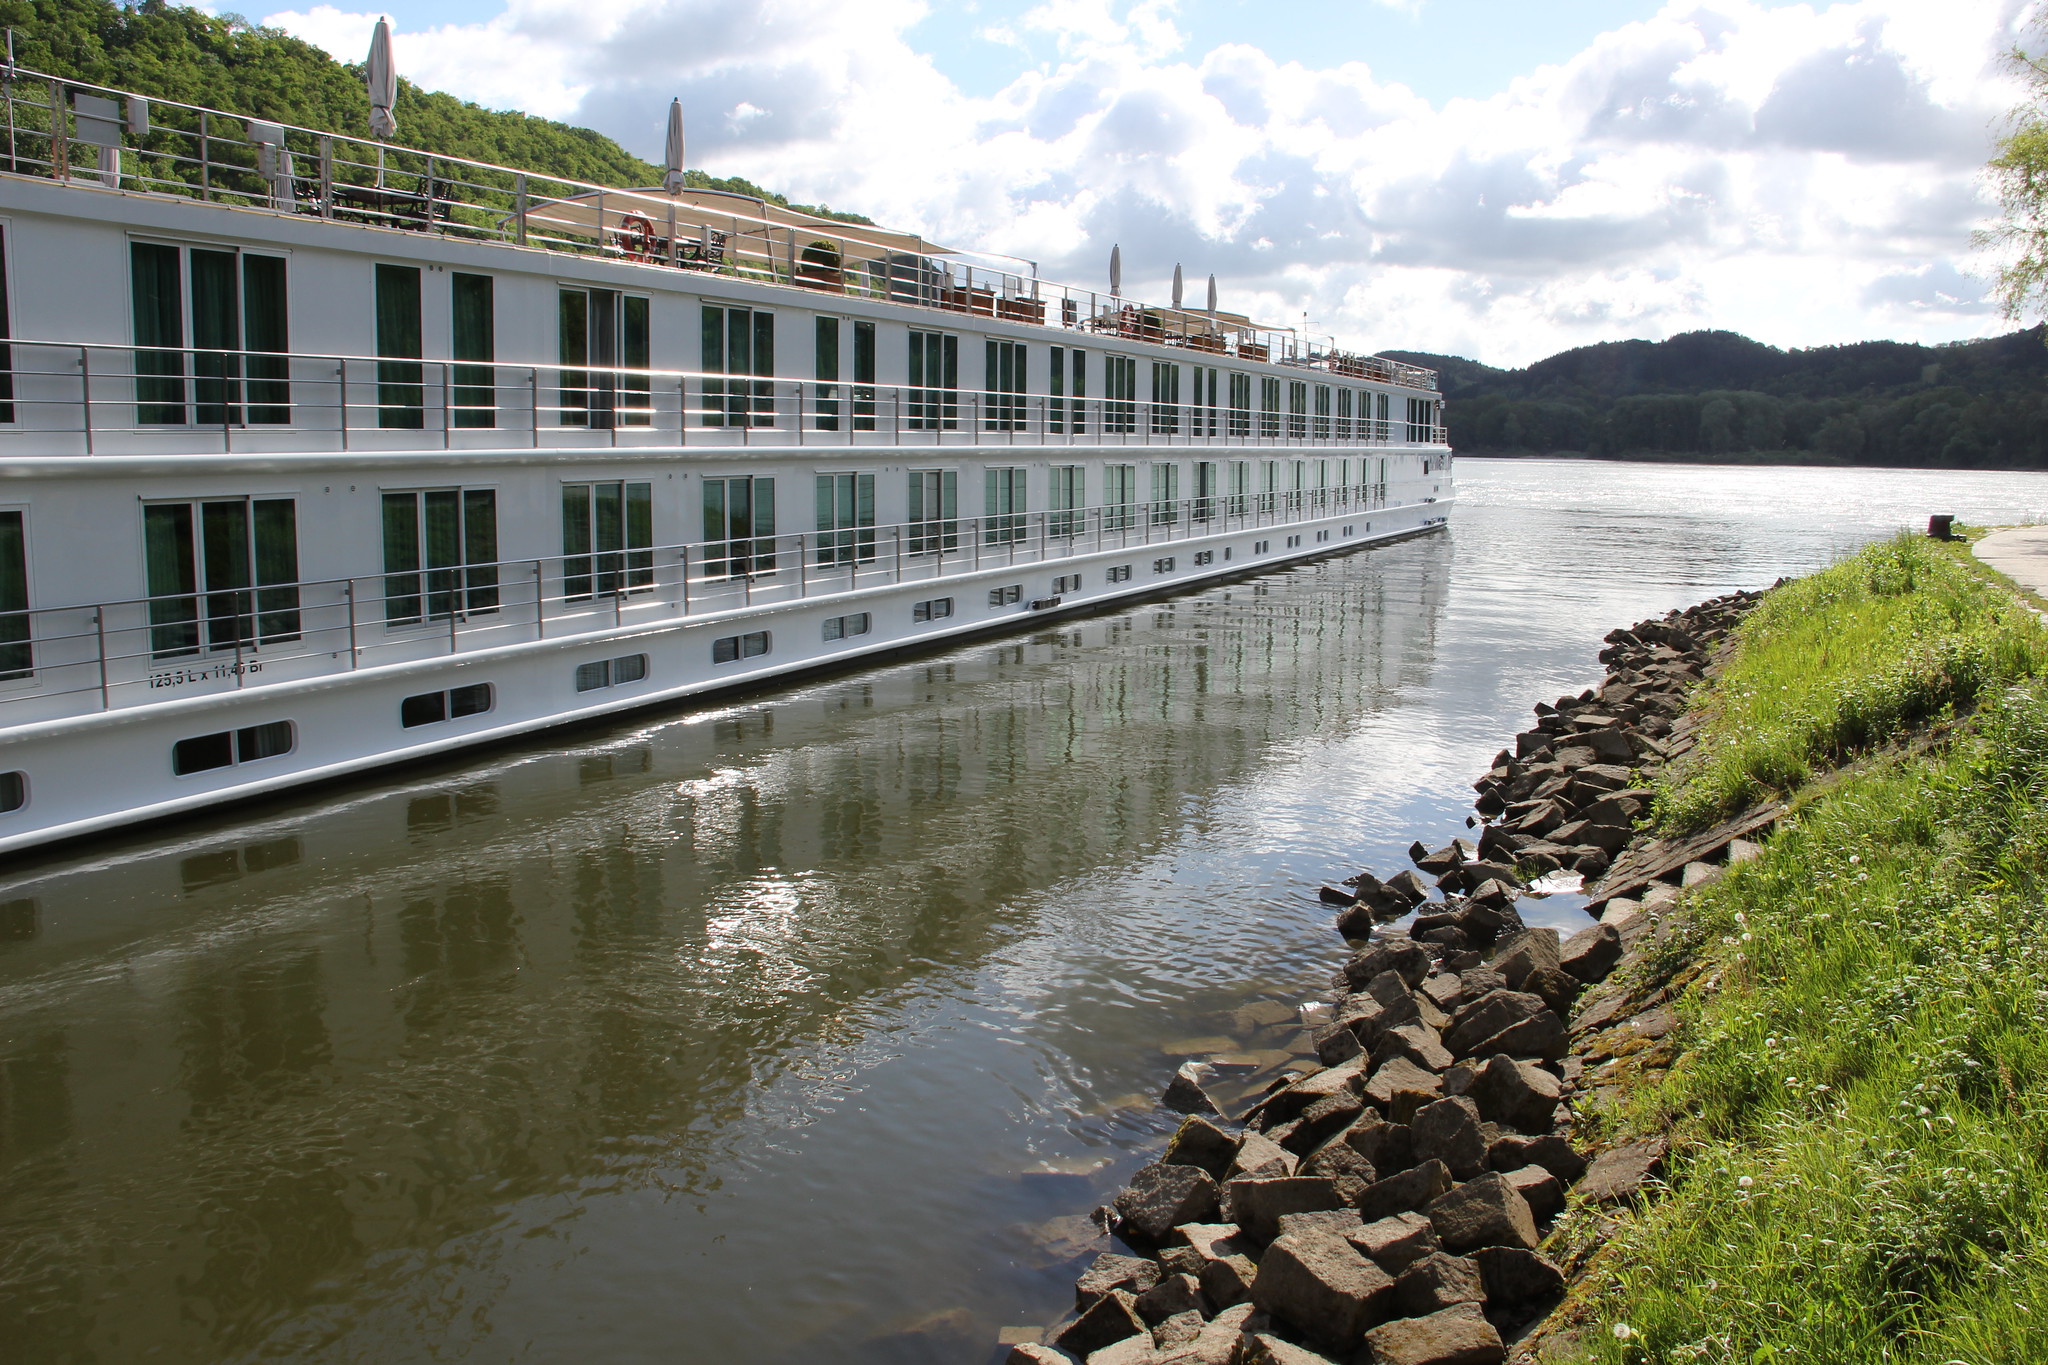
River Cruising
While mass cruises to destinations like the Caribbean remain incredibly popular, river cruises are emerging as another strong segment of the industry. The key differences between river cruises and ocean cruises are (Hill, 2013):
- River cruise ships are smaller (400 feet long by 40 feet wide on average) and can navigate narrow passages.
- River cruises carry fewer passengers (about 10% of the average cruise, or 200 passengers total).
- Beer, wine, and high-end cuisine are generally offered in the standard package.
The price point for river cruises is around the same as ocean trips, with the typical cost ranging from $2,000 to $4,000, depending on the itinerary, accommodations, and other amenities.
From 2008 to 2013, river cruises saw a 10% annual passenger increase. Europe leads the subcategory, while emerging destinations include a cruise route along China’s Yangtze River. As the on-board experience differs greatly from a larger cruise (no play areas, water parks, or on-board stage productions), the target demographic for river cruises is 50- to 70-year-olds. According to Torstein Hagen, founder and chairman of Viking, an international river cruising company, “with river cruises, a destination is the destination,” although many river cruises are themed around cultural or historical events (Hill, 2013).
Cruising in Canada
According to a study completed for the North West & Canada Cruise Association (NWCCA) and its partners, in 2012, approximately 1,100 cruise ship calls were made at Canadian cruise ports generating slightly more than 2 million passenger arrivals throughout the six-month cruise season (BREA, 2013). The study found three key cruise itineraries in Canada:
- Canada/New England
- Quebec (between Montreal and Quebec City and US ports)
- Alaska (either departing from, or using, Vancouver or another BC city as a port of call)
These generated $1.16 billion in direct spending. Cruising also generated almost 10,000 full- and part-time jobs paying $397 million in wages and salaries. The international cruise industry also generated an estimated $269 million in indirect business and income taxes in Canada, and the majority of this spending was in British Columbia (BREA, 2013).
Cruising isn't the only way for visitors to experience the waters of Canada. In fact, the vast majority of our water travel is done by ferry. Let's take a closer look at this vital component of transportation infrastructure.
Ferries
Canada is home to over 180 different ferry routes with a route presently operating in each province and the majority of the territories. These ferries represent a mix of private and publicly operated routes and well as a mix of passenger, freight, and mixed-use ferries.
Transportation through waterways has always been a crucial part of Canada’s history. From the First Nations traveling by canoes through rivers, lakes and parts of the oceans to the early explorers, there has always been an emphasis on the transportation of people by boats.
The British and French colonies saw the development of more modern types of transportation on waterways including ferries that functioned to transport the public (usually private ferries) and troops (public ferries).
(Canadian Ferry Association, 2021)
In 2011, Travel + Leisure Magazine profiled several notable ferry journeys in the article "World's Most Beautiful Ferry Rides," including:
- An 800-mile ferry voyage through Chile's Patagonian fjords
- A three-mile trip from the Egyptian Spice Market to Istanbul, Turkey
- Urban ferry rides including Hong Kong's Victoria Harbour, Australia's Sydney Harbour, and New York City's Staten Island Ferry
The article also featured the 15-hour trip from Port Hardy to Prince Rupert on British Columbia's coast (Orcutt, 2011).
While cruising is often a pleasant and relaxing experience, there are a number of safety concerns for vessels of all types.
Cruise and Ferry Safety
One of the major concerns on cruise lines is disease outbreak, specifically the norovirus (a stomach flu), which can spread quickly on cruise ships as passengers are so close together. The US Centers for Disease Control's (CDC) vessel sanitation program is designed to help the industry prevent and control the outset, and spreading, of these types of illnesses (Briggs, 2008).
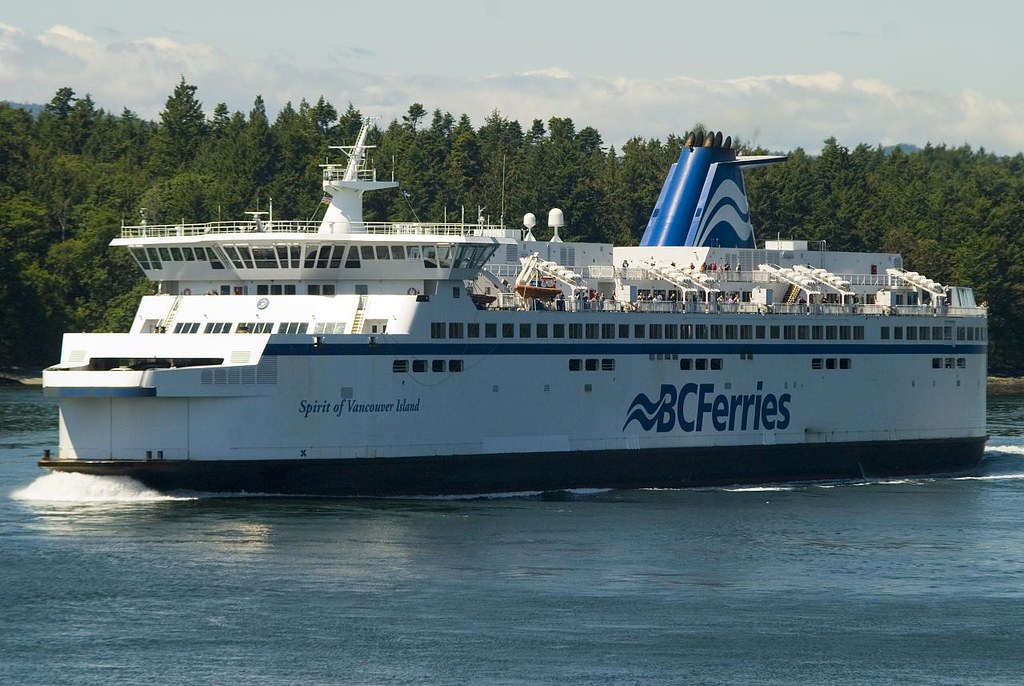
Accidents are also a concern. In 2006, the BC Ferries vessel MV Queen of the North crashed and sank in the Inside Passage, leaving two passengers missing and presumed dead. The ship's navigating officer was charged with criminal negligence causing their deaths (Keller, 2013). More recently, a "hard landing" at Duke Point terminal on Vancouver Island caused over $4 million in damage. BC Ferries launched a suit against a German engineering firm in late 2013, alleging a piece of equipment failed, making a smooth docking impossible. The Transportation Safety Board found that staff aboard the ship didn't follow proper docking procedures, however, which contributed to the crash (Canadian Press, 2013).
Spotlight On: The Transportation Safety Board
The Transportation Safety Board (TSB) investigates marine, pipeline, rail, and air incidents. It is an independent agency that reviews an average of 3,200 events every year. It does not determine liability; however, coroners and medical examiners may use TSB findings in their investigations. The head office in Quebec manages 220 staff across the country. For more information, visit the Transportation Safety Board website.
We've covered the skies, the rails, and the seas. Now let's round out our investigation of transportation in tourism by delving into travel on land.
Image Credits
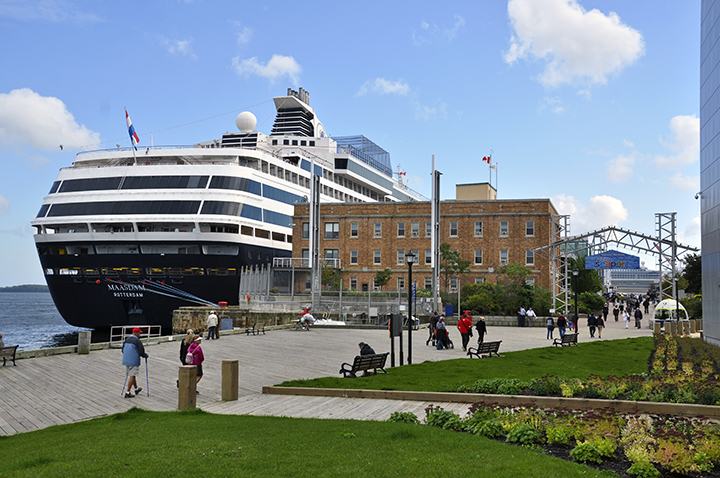
Cruise ship at Pier 20 by Halifax Regional Municipality Public Affairs office on Wikimedia Commons is licenced under a CC BY-SA 4.0 licence.
Uniworld River Cruises River Beatrice in Passau Germany by Gary Bembridge on Flickr is licenced under a CC BY 2.0 licence.
The amount left when expenses (including corporate income tax) are subtracted from sales revenue.
