Chapter 11: Budget Planning
Learning Objectives
- Identify tools and techniques for estimating cost.
- Analyze and evaluate budget and cost estimates.
- Apply indices to manage project progress and budgets.
- Propose ways to monitor and track budget progress, improve estimates and respond to budget uncertainty.
Every project boils down to money. If you had a bigger budget, you could probably get more people to do your project more quickly and deliver more. That’s why no project plan is complete until you come up with a budget. But no matter whether your project is big or small, and no matter how many resources and activities are in it, the process for figuring out the bottom line is always the same.
It is important to come up with detailed estimates for all the project costs. Once this is compiled, you add up the cost estimates into a budget plan. It is now possible to track the project according to that budget while the work is ongoing.
Often, when you come into a project, there is already an expectation of how much it will cost or how much time it will take. When you make an estimate early in the project without knowing much about it, that estimate is called a rough order-of-magnitude estimate (or a ballpark estimate). This estimate will become more refined as time goes on and you learn more about the project. Here are some tools and techniques for estimating cost:
Determination of resource cost rates: People who will be working on the project all work at a specific rate. Any materials you use to build the project (e.g., wood or wiring) will be charged at a rate too. Determining resource costs means figuring out what the rate for labor and materials will be.
Vendor bid analysis: Sometimes you will need to work with an external contractor to get your project done. You might even have more than one contractor bid on the job. This tool is about evaluating those bids and choosing the one you will accept.
Reserve analysis: You need to set aside some money for cost overruns. If you know that your project has a risk of something expensive happening, it is better to have some cash available to deal with it. Reserve analysis means putting some cash away in case of overruns.
Cost of quality: You will need to figure the cost of all your quality-related activities into the overall budget. Since it’s cheaper to find bugs earlier in the project than later, there are always quality costs associated with everything your project produces. Cost of quality is just a way of tracking the cost of those activities. It is the amount of money it takes to do the project right.
Once you apply all the tools in this process, you will arrive at an estimate for how much your project will cost. It’s important to keep all of your supporting estimate information. That way, you know the assumptions made when you were coming up with the numbers. Now you are ready to build your budget plan.
Estimating Costs to Compare and Select Projects
During the conceptual phase when project selection occurs, economic factors are an important consideration in choosing between competing projects. To compare the simple paybacks or internal rates of return between projects, an estimate of the cost of each project is made. The estimates must be accurate enough so that the comparisons are meaningful, but the amount of time and resources used to make the estimates should be appropriate to the size and complexity of the project. The methods used to estimate the cost of the project during the selection phase are generally faster and consume fewer resources than those used to create detailed estimates in later phases. They rely more on the expert judgment of experienced managers who can make accurate estimates with less detailed information. Estimates in the earliest stages of project selection are usually based on information from previous projects that can be adjusted—scaled—to match the size and complexity of the current project or developed using standardized formulas.
Analogous Estimate
An estimate that is based on other project estimates is an analogous estimate. If a similar project cost a certain amount, then it is reasonable to assume that the current project will cost about the same. Few projects are exactly the same size and complexity, so the estimate must be adjusted upward or downward to account for the differences. The selection of projects that are similar and the amount of adjustment needed is up to the judgment of the person who makes the estimate. Normally, this judgment is based on many years of experience estimating projects, including incorrect estimates that were learning experiences for the expert.
Less-experienced managers who are required to make analogous estimates can look through the documentation that is available from previous projects. If projects were evaluated using the Darnall-Preston Complexity Index (DPCI), the manager can quickly identify projects that have profiles similar to the project under consideration, even if those projects were managed by other people.
The DPCI assesses project attributes, enabling better-informed decisions in creating the project profile. This index assesses the complexity level of key components of a project and produces a unique project profile. The profile indicates the project complexity level, which provides a benchmark for comparing projects and information about the characteristics of a project that can then be addressed in the project execution plan. It achieves this objective by grouping 11 attributes into four broad categories: internal, external, technological complexity, and environmental.
Comparing the original estimates with the final project costs on several previous projects with the same DPCI ratings gives a less-experienced manager the perspective that it would take many years to acquire by trial and error. It also provides references the manager can use to justify the estimate.
Example: Analogous Estimate for John’s Move
John sold his apartment and purchased another one. It is now time to plan for the move. John asked a friend for advice about the cost of his move. His friend replied, “I moved from an apartment a little smaller than yours last year and the distance was about the same. I did it with a 14-foot truck. It cost about $575 for the truck rental, pads, hand truck, rope, boxes, and gas.” Because of the similarity of the projects, John’s initial estimate of the cost of the move was less than $700 so he decided that the cost would be affordable and the project could go forward.
Parametric Estimate
If the project consists of activities that are common to many other projects, average costs are available per unit. For example, if you ask a construction company how much it would cost to build a standard office building, the estimator will ask for the size of the building in square feet and the city in which the building will be built. From these two factors—size and location—the company’s estimator can predict the cost of the building. Factors like size and location are parameters—measurable factors that can be used in an equation to calculate a result. The estimator knows the average cost per square foot of a typical office building and adjustments for local labor costs. Other parameters such as quality of finishes are used to further refine the estimate. Estimates that are calculated by multiplying measured parameters by cost-per-unit values are parametric estimates.
Example: Parametric Estimate for John’s Move
To estimate the size of the truck needed for John’s move, the parameter used by a truck rental company is the number of bedrooms (Figure 11.1). The company assumes that the number of bedrooms is the important parameter in determining how big a truck is needed for a move. John has a one-bedroom apartment, so he chooses the 14-foot truck. Once the size is determined, other parameters, such as distance and days, are used to estimate the cost of the truck rental.

Bottom-Up Estimating
The most accurate and time-consuming estimating method is to identify the cost of each item in each activity of the schedule, including labor and materials. If you view the project schedule as a hierarchy where the general descriptions of tasks are at the top and the lower levels become more detailed, finding the price of each item at the lowest level and then summing them to determine the cost of higher levels is called bottom-up estimating.
Example: Bottom-Up Estimate for John’s Move
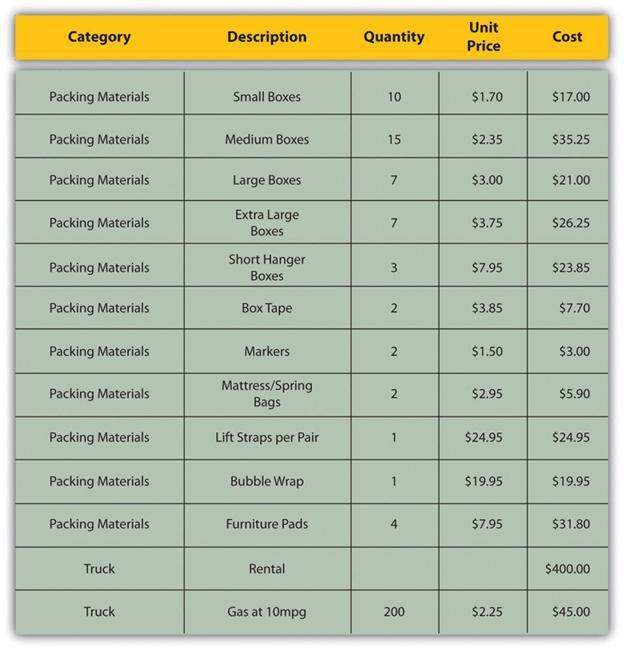
After evaluating the bids by the moving companies, John decides the savings are worth his time if he can get the packing done with the help of his friends. He decides to prepare a detailed estimate of costs (Figure 11.2) for packing materials and use of a rental truck. He looks up the prices for packing materials and truck rental costs on company websites and prepares a detailed list of items, quantities, and costs.
This type of estimate is typically more accurate than an analogous or parametric estimate. In this example, the sum of packing materials and truck expenses is estimated to be $661.25.
The estimate can be rolled up—subtotaled—to display less detail. This process is made easier using computer software. On projects with low complexity, the cost estimates can be done on spreadsheet software. On larger projects, software that manages schedules can also manage costs and display them by activity and category. For example, the subtotal feature could be used in Excel and collapsed to show the subtotals for the two categories of costs (Figure 11.3).

Activity-Based Estimates
An activity can have costs from multiple vendors in addition to internal costs for labor and materials. Detailed estimates from all sources can be reorganized so those costs associated with a particular activity can be grouped by adding the activity code to the detailed estimate (Figure 11.4).
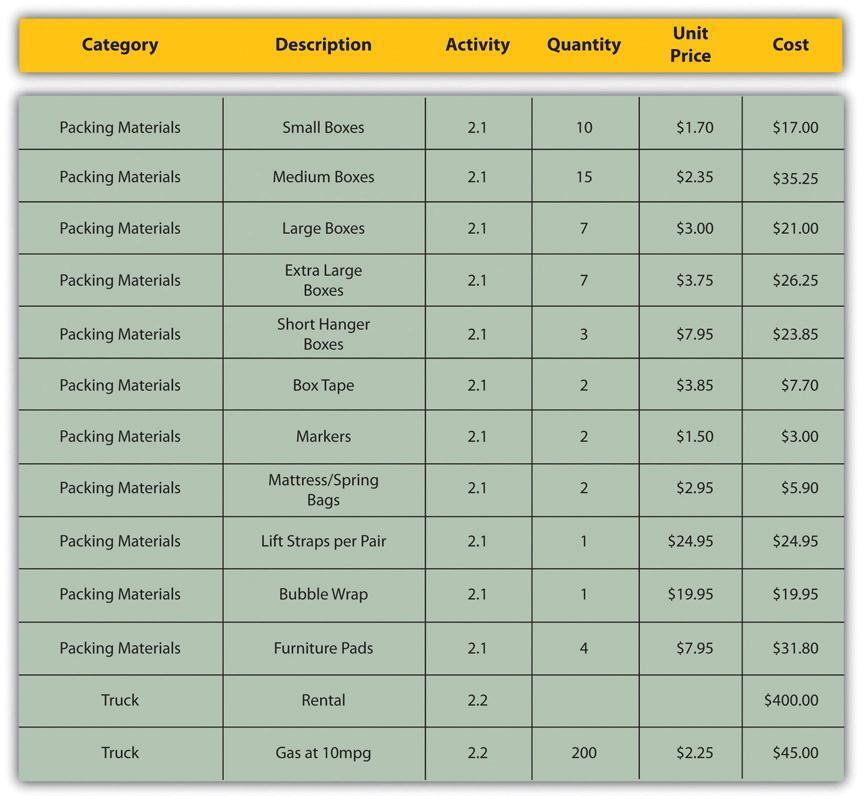
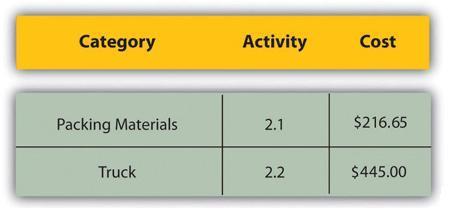
The detailed cost estimates can be sorted and then subtotaled by activity to determine the cost for each activity.
Managing the Budget
Projects seldom go according to plan in every detail. It is necessary for the project manager to be able to identify when costs are varying from the budget and manage those variations.
Managing Cash Flow
If the total amount spent on a project is equal to or less than the amount budgeted, the project can still be in trouble if the funding for the project is not available when it is needed. There is a natural tension between the financial people in an organization, who do not want to pay for the use of money that is just sitting in a checking account, and the project manager, who wants to be sure that there is enough money available to pay for project expenses. The financial people prefer to keep the company’s money working in other investments until the last moment before transferring it to the project account. The contractors and vendors have similar concerns, and they want to get paid as soon as possible so they can put the money to work in their own organizations. The project manager would like to have as much cash available as possible to use if activities exceed budget expectations.
Contingency Reserves
Most projects have something unexpected occur that increases costs above the original estimates. If estimates are rarely exceeded, the estimating method should be reviewed because the estimates are too high. It is impossible to predict which activities will cost more than expected, but it is reasonable to assume that some of them will. Estimating the likelihood of such events is part of risk analysis, which is discussed in more detail in a later chapter.
Instead of overestimating each cost, money is budgeted for dealing with unplanned but statistically predictable cost increases. Funds allocated for this purpose are called contingency reserves. Because it is likely that this money will be spent, it is part of the total budget for the project. If this fund is adequate to meet the unplanned expenses, then the project will complete within the budget.
Management Reserves
If something occurs during the project that requires a change in the project scope, money may be needed to deal with the situation before a change in scope can be negotiated with the project sponsor or client. It could be an opportunity as well as a challenge. For example, if a new technology were invented that would greatly enhance your completed project, there would be additional cost and a change to the scope, but it would be worth it. Money can be made available at the manager’s discretion to meet needs that would change the scope of the project. These funds are called management reserves. Unlike contingency reserves, they are not likely to be spent and are not part of the project’s budget baseline, but they can be included in the total project budget.
Evaluating the Budget during the Project
A project manager must regularly compare the amount of money spent with the budgeted amount and report this information to managers and stakeholders. It is necessary to establish an understanding of how this progress will be measured and reported.
Example: Reporting Budget Progress on John’s Move
In the John’s move example, he estimated that the move would cost about $1,500 and take about 16 days. Eight days into the project, John has spent $300. John tells his friends that the project is going well because he is halfway through the project but has only spent a fifth of his budget. John’s friend Carlita points out that his report is not sufficient because he did not compare the amount spent to the budgeted amount for the activities that should be done by the eighth day.
As John’s friend pointed out, a budget report must compare the amount spent with the amount that is expected to be spent by that point in the project. Basic measures such as percentage of activities completed, percentage of measurement units completed, and percentage of budget spent are adequate for less complex projects, but more sophisticated techniques are used for projects with higher complexity.
Earned Value Analysis
A method that is widely used for medium- and high-complexity projects is the earned value management (EVM) method. EVM is a method of periodically comparing the budgeted costs with the actual costs during the project. It combines the scheduled activities with detailed cost estimates of each activity. It allows for partial completion of an activity if some of the detailed costs associated with the activity have been paid but others have not.
The budgeted cost of work scheduled (BCWS) comprises the detailed cost estimates for each activity in the project. The amount of work that should have been done by a particular date is the planned value (PV). These terms are used interchangeably by some sources, but the planned value term is used in formulas to refer to the sum of the budgeted cost of work up to a particular point in the project, so we will make that distinction in the definitions in this text for clarity.
Example: Planned Value on Day Six of John’s Move
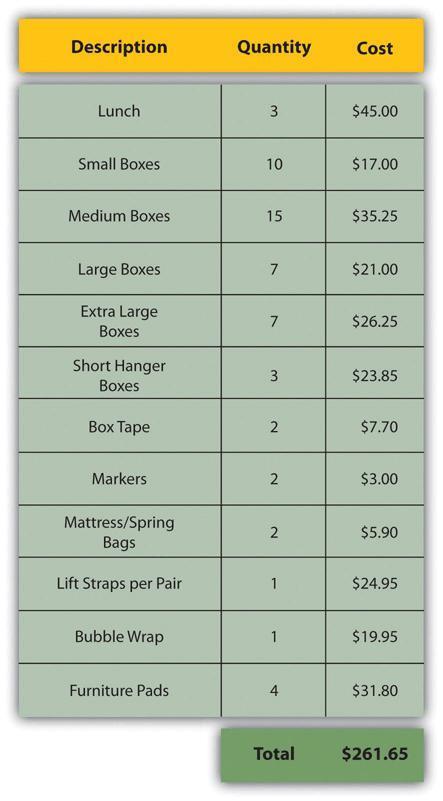
On day six of the project, John should have taken his friends to lunch and purchased the packing materials. The portion of the BCWS that should have been done by that date (the planned value) is shown in Figure 11.5. This is the planned value for day six of the project.
The budgeted cost of work performed (BCWP) is the budgeted cost of work scheduled that has been done. If you sum the BCWP values up to that point in the project schedule, you have the earned value (EV). The amount spent on an item is often more or less than the estimated amount that was budgeted for that item. The actual cost (AC) is the sum of the amounts actually spent on the items.
Example: Comparing PV, EV, and AC in John’s Move on Day Six
Dion and Carlita were both trying to lose weight and just wanted a nice salad. Consequently, the lunch cost less than expected. John makes a stop at a store that sells moving supplies at discount rates. They do not have all the items he needs, but the prices are lower than those quoted by the moving company. They have a very good price on lifting straps so he decides to buy an extra pair. He returns with some of the items on his list, but this phase of the job is not complete by the end of day six. John bought half of the small boxes, all of five other items, twice as many lifting straps, and none of four other items. John is only six days into his project, and his costs and performance are starting to vary from the plan. Earned value analysis gives us a method for reporting that progress (Figure 11.6).
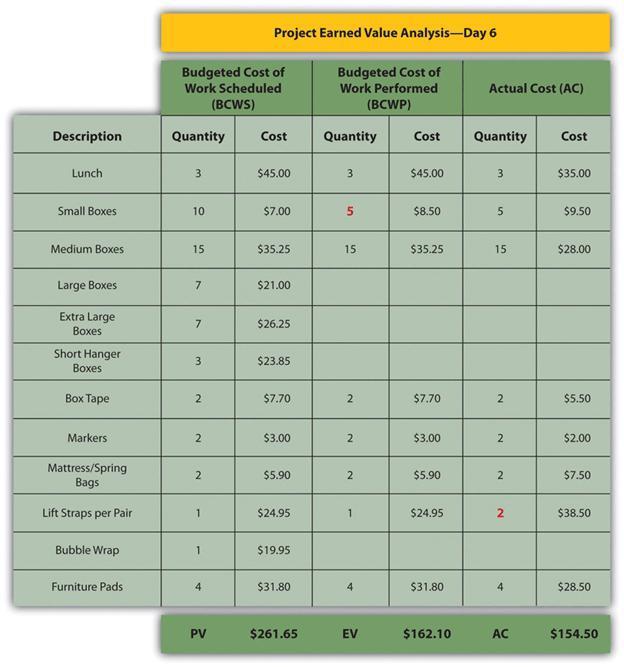
The original schedule called for spending $261.65 (PV) by day six. The amount of work done was worth $162.10 (EV) according to the estimates, but the actual cost was only $154.50 (AC).
Schedule Variance
The project manager must know if the project is on schedule and within the budget. The difference between planned and actual progress is the variance. The schedule variance (SV) is the difference between the earned value (EV) and the planned value (PV). Expressed as a formula, SV = EV − PV. If less value has been earned than was planned, the schedule variance is negative, which means the project is behind schedule.
Example: Schedule Variance on John’s Move
Planning for John’s move calls for spending $261.65 by day six, which is the planned value (PV). The difference between the planned value and the earned value is the scheduled variance (SV). The formula is SV = EV − PV. In this example, SV = $162.10 − $261.65 = ($99.55) A negative SV indicates the project is behind schedule.
The difference between the earned value (EV) and the actual cost (AC) is the cost variance (CV). Expressed as a formula, CV = EV – AC. A positive CV indicates the project is under budget.
Example: Cost Variance on John’s Move
The difference between the earned value of $162.10 and the actual cost of $154.50 is the cost variance (CV). The formula is CV = EV − AC. In this example, CV = $162.10 − $154.50 = $7.60.
Variance Indexes for Schedule and Cost
The schedule variance and the cost variance provide the amount by which the spending is behind (or ahead of) schedule and the amount by which a project is exceeding (or not fully using) its budget. They do not give an idea of how these amounts compare with the total budget.
The ratio of earned value to planned value gives an indication of how much of the project is completed. This ratio is the schedule performance index (SPI). The formula is SPI = EV/PV. In the John’s move example, the SPI equals 0.62 (SPI = $162.10/$261.65 = 0.62) An SPI value less than 1 indicates the project is behind schedule.
The ratio of the earned value to the actual cost is the cost performance index (CPI). The formula is CPI = EV/AC.
Example: Cost Performance Index of John’s Move
In the John’s move example, CPI = $162.10/$154.50 = 1.05. A value greater than 1 indicates that the project is under budget.
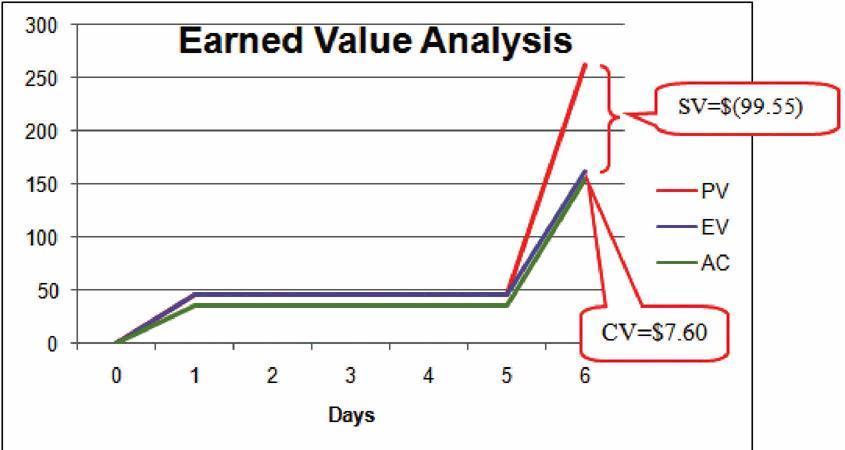
The cost variance of positive $7.60 and the CPI value of 1.05 tell John that he is getting more value for his money than planned for the tasks scheduled by day six. The schedule variance (SV) of negative $99.55 and the schedule performance index (SPI) of 0.62 tell him that he is behind schedule in adding value to the project (Figure 11.7).
During the project, the manager can evaluate the schedule using the schedule variance (SV) and the schedule performance index (SPI), and the budget using the cost variance (CV) and the cost performance index (CPI).
Estimated Cost to Complete the Project
Part way through the project, the manager evaluates the accuracy of the cost estimates for the activities that have taken place and uses that experience to predict how much money it will take to complete the unfinished activities—the estimate to complete (ETC).
To calculate the ETC, the manager must decide if the cost variance observed in the estimates to that point are representative of the future. For example, if unusually bad weather causes increased cost during the first part of the project, it is not likely to have the same effect on the rest of the project. If the manager decides that the cost variance up to this point in the project is atypical—not typical—then the estimate to complete is the difference between the original budget for the entire project—the budget at completion (BAC)—and the earned value (EV) up to that point. Expressed as a formula, ETC = BAC − EV.
Example: Estimate to Complete John’s Move
For his move, John was able to buy most of the items at a discount house that did not have a complete inventory, and he chose to buy an extra pair of lift straps. He knows that the planned values for packing materials were obtained from the price list at the moving company where he will have to buy the rest of the items, so those two factors are not likely to be typical of the remaining purchases. The reduced cost of lunch is unrelated to the future costs of packing materials, truck rentals, and hotel fees. John decides that the factors that caused the variances are atypical. He calculates that the estimate to complete (ETC) is the budget at completion ($1,534) minus the earned value at that point ($162.10), which equals $1,371.90. Expressed as a formula, ETC = $1,534 − $162.10 = $1,371.90.
If the manager decides that the cost variance is caused by factors that will affect the remaining activities, such as higher labor and material costs, then the estimate to complete (ETC) needs to be adjusted by dividing it by the cost performance index (CPI). For example, if labor costs on the first part of a project are estimated at $80,000 (EV) and they actually cost $85,000 (AC), the cost performance (CPI) will be 0.94. (Recall that the CPI = EV/AC.)
To calculate the estimate to complete (ETC), assuming the cost variance on known activities is typical of future cost, the formula is ETC = (BAC – EV)/CPI. If the budget at completion (BAC) of the project is $800,000, the estimate to complete is ($800,000 – $80,000)/0.94 = $766,000.
Estimate Final Project Cost
If the costs of the activities up to the present vary from the original estimates, this will affect the total estimate of the project cost. The new estimate of the project cost is the estimate at completion (EAC). To calculate the EAC, the estimate to complete (ETC) is added to the actual cost (AC) of the activities already performed. Expressed as a formula, EAC = AC + ETC.
Example: Estimate at Completion for John’s Move
The revised estimate at completion (EAC) for John’s move at this point in the process is EAC = $154.50 + $1,371.90 = $1,526.40.
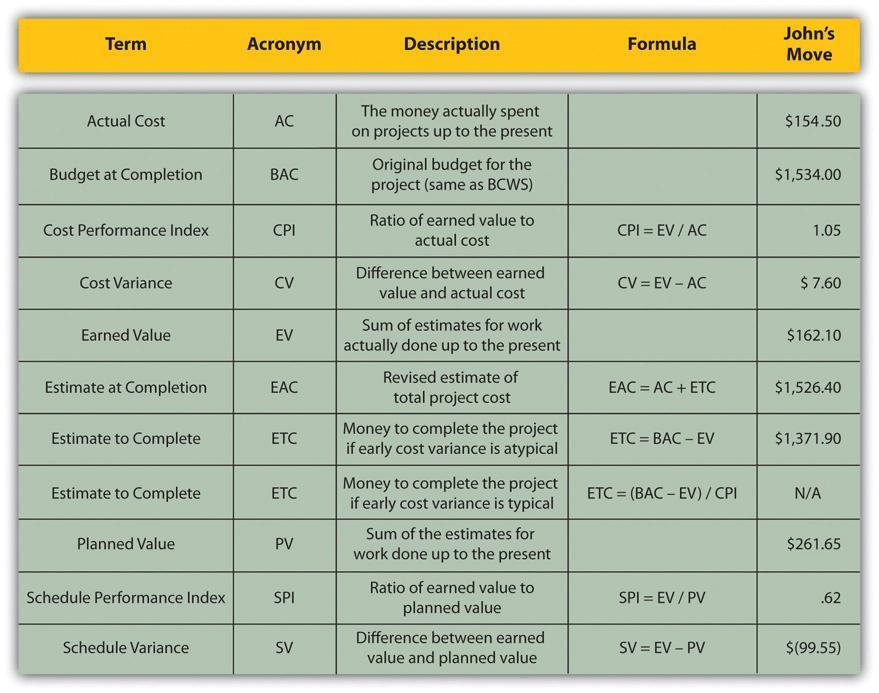
To summarize (Figure 11.8):
- Extra money is allocated in a contingency fund to deal with activities where costs exceed estimates. Funds are allocated in a management reserve in case a significant opportunity or challenge occurs that requires change of scope but funds are needed immediately before a scope change can typically be negotiated.
- Schedule variance is the difference between the part of the budget that has been spent so far (EV) versus the part that was planned to be spent by now (PV). Similarly, the cost variance is the difference between the EV and the actual cost (AC).
- The schedule performance index (SPI) is the ratio of the earned value and the planned value. The cost performance index (CPI) is the ratio of the earned value (EV) to the actual cost (AC).
- The formula used to calculate the amount of money needed to complete the project (ETC) depends on whether or not the cost variance to this point is expected to continue (typical) or not (atypical). If the cost variance is atypical, the ETC is simply the original total budget (BAC) minus the earned value (EV). If they are typical of future cost variances, the ETC is adjusted by dividing the difference between BAC and EV by the CPI.
- The final budget is the actual cost (AC) to this point plus the estimate to complete (ETC).
Establishing a Budget
Once you have broken your project down into activities, you will be able to calculate your overall project costs by estimating and totaling the individual activity costs.
This process of subtotaling costs by category or activity is called cost aggregation.
Budget Timeline
Costs are associated with activities, and since each activity has a start date and a duration period, it is possible to calculate how much money will be spent by any particular date during the project. The money needed to pay for a project is usually transferred to the project account shortly before it is needed. These transfers must be timed so that the money is there to pay for each activity without causing a delay in the start of the activity. If the money is transferred too far in advance, the organization will lose the opportunity to use the money somewhere else, or they will have to pay unnecessary interest charges if the money is borrowed. A schedule of money transfers is created that should match the need to pay for the activities. The process of matching the schedule of transfers with the schedule of activity payments is called reconciliation. Refer to Figure 11.9, which shows the costs of 10 major activities in a project. Funds are transferred into the project account four times. Notice that during most of the project, there were more funds available than were spent except at activity 6 when all the available funds were spent.
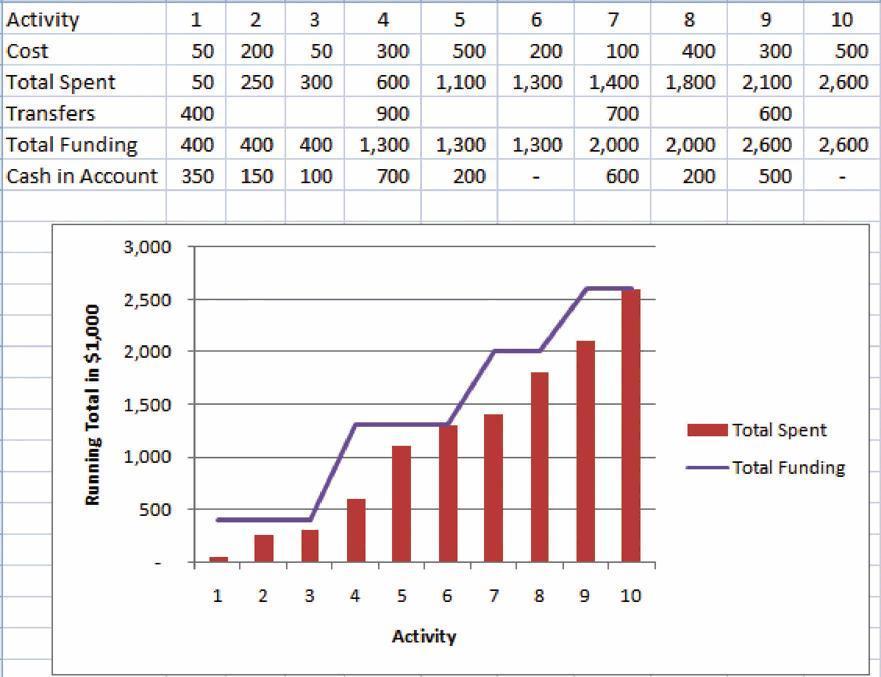
In the project budget profile shown in Figure 11.9, there is no margin for error if the total of the first six activities exceeds the amount of funding at that point in the project.
Contractual agreements with vendors often require partial payment of their costs during the project. Those contracts can be managed more conveniently if the unit of measure for partial completion is the same as that used for cost budgeting. For example, if a graphic designer is putting together several pieces of artwork for a textbook, their contract may call for partial payment after 25% of their total number of drawings is complete.
Key Takeaways
- It is important to come up with detailed estimates for all the project costs. Once this is compiled, you add up the cost estimates into a budget plan. It is now possible to track the project according to that budget while the work is ongoing.
- Projects seldom go according to plan in every detail. It is necessary for the project manager to be able to identify when costs are varying from the budget and manage those variations.
- Earned Value Analysis (EVA) is a method of periodically comparing the budgeted costs with the actual costs during the project. It combines the scheduled activities with detailed cost estimates of each activity. It allows for partial completion of an activity if some of the detailed costs associated with the activity have been paid but others have not.
- Contingency funds allow for the unexpected.
- Reporting to the team and to management are important components in budget management.
Attribution
This chapter is based on chapter 12 in Project Management by Adrienne Watt.
Adaption notes from edition written by Adrienne Watts:
- Introductory text was adapted from “Budget Planning” in Project Management for Skills for All Careers by Project Management Open Resources and TAP-a-PM. Licensed under a CC BY 3.0 licence.
- Text under “Estimating Costs” and “Managing the Budget” was adapted from “Costs and Procurement” in Project Management for Instructional Designers by Amado, M., Ashton, K., Ashton, S., Bostwick, J., Clements, G., Drysdale, J., Francis, J., Harrison, B., Nan, V., Nisse, A., Randall, D., Rino, J., Robinson, J., Snyder, A., Wiley, D., & Anonymous. Licensed under a CC BY-NC-SA (Attribution-NonCommercial-ShareAlike) licence.
- Text under “Budget Timeline” was adapted from “Estimating Costs” in Project Management From Simple to Complex by author whose name has been removed at the request of the original publisher. Licensed under CC BY-NC-SA 4.0 licence.

