
Chapter 9: Project Schedule Planning
Learning Objectives
- Apply effective scheduling tools and techniques to sequence and accurately estimate activity duration.
- Outline the benefits of using scheduling tools such as Gantt chart and network diagrams.
- Create a draft schedule
- Optimize the schedule
- Examine the significance of the critical path.
Defining Activities
The activity definition process is a further breakdown of the work package elements of the WBS. It documents the specific activities needed to fulfill the deliverables detailed in the WBS. These activities are not the deliverables themselves but the individual units of work that must be completed to fulfill the deliverables. Activity definition uses everything we already know about the project to divide the work into activities that can be estimated. You might want to look at all the lessons learned from similar projects your company has done to get a good idea of what you need to do on the current one.
Expert judgment in the form of project team members with prior experience developing project scope statements and WBS can help you define activities. If you are asked to manage a project in a new domain, you might also use experts in that particular field to help define tasks so you can understand what activities are going to be involved. You may want to create an activity list and then have the expert review it and suggest changes. Alternatively, you could involve the expert from the very beginning and ask to have an activity definition conversation with him or her before even making your first draft of the list.
Sometimes you start a project without knowing a lot about the work that you’ll be doing later. Rolling-wave planning lets you plan and schedule only the portion that you know enough about to plan well. When you don’t know enough about a project, you can use placeholders for the unknown portions until you know more. These are extra items that are put at high levels in the WBS to allow you to plan for the unknown.
A Case Study
Susan and Steve have decided to tie the knot, but they don’t have much time to plan their wedding. They want the big day to be unforgettable. They want to invite many people and provide a great time. They’ve always dreamed of a June wedding, but it’s already January. Just thinking about all of the details involved is overwhelming. Susan has been dreaming of the big day since she was 12, but it seems that there’s so little time for all the tasks to be completed. When they were choosing the paper for the invitations, the couple realized that they needed help.
Steve: Don’t worry. My sister’s wedding planner was great. Let me give her a call. [Steve calls the wedding planner Sally.]
Wedding Planner: Hello, Susan and Steve.
Steve: We want everything to be perfect.
Susan: There is so much to do! Invitations, food, guests, and music.
Steve: Oh no, we haven’t even booked a place!
Susan: And it has to be done right. We can’t print the invitations until we have the menu planned. We can’t do the seating arrangements until we have the RSVPs. We aren’t sure what kind of band to get for the reception, or should it be a DJ? We’re just overwhelmed.
Steve: My sister said you really saved her wedding. I know she gave you over a year to plan. But I’ve always dreamed of a June wedding, and I’m not willing to give that up. I know it’s late, but Sally, can you help us?
Wedding Planner: Take it easy. I’ve got it under control. We’ve a lot of people and activities to get under control. You really should have called six months ago, but we’ll still make this wedding happen on time.
Much work has to be done before June. First, Sally figures out what work needs to be done. She starts to put together a to-do list:
- Invitations
- Flowers
- Wedding cake
- Dinner menu
- Band
Since many different people are involved in the making of the wedding, it takes much planning to coordinate all the work in the right order by the right people at the right time. Initially, Sally was worried that she didn’t have enough time to make sure that everything would be done properly. However, she knew that she had some powerful time management tools on her side when she took the job, and these tools would help her to synchronize all the required tasks.
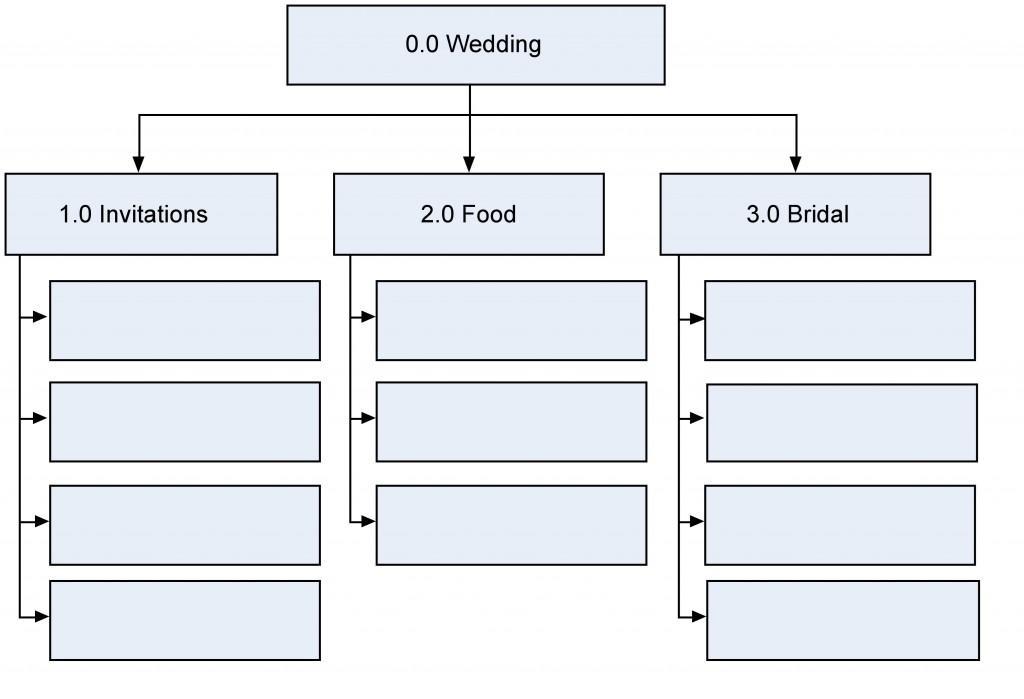
To get started, Sally arranged all the activities in a work breakdown structure. The next exercise presents part of the WBS Sally made for the wedding.
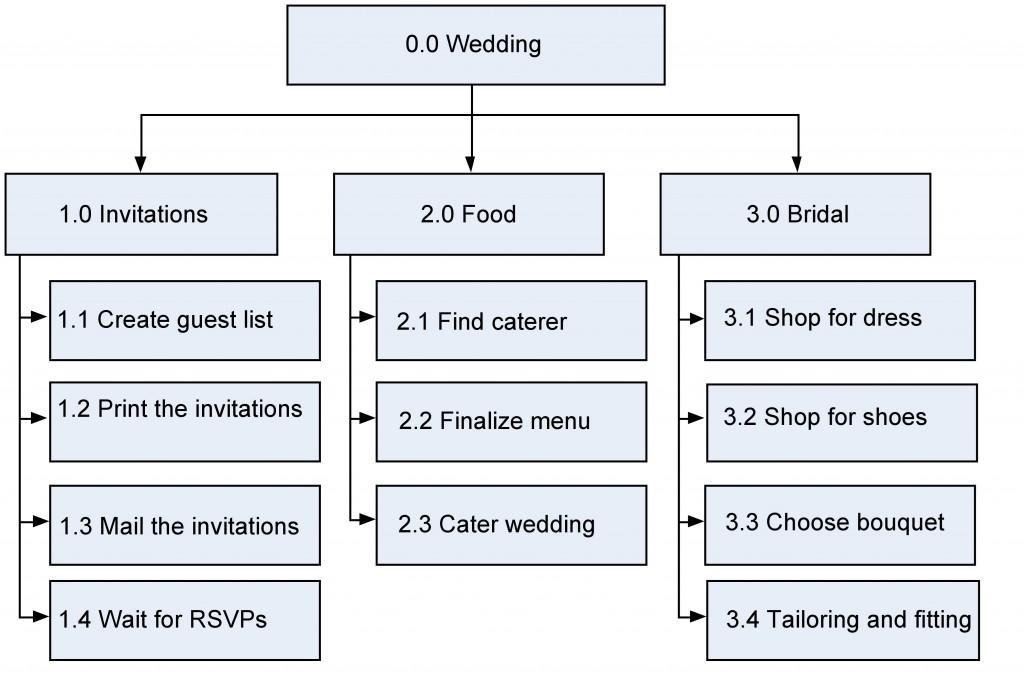
Arrange the following activities into the WBS – Figure 9.1 to show how the work items decompose into activities.
- Shop for shoes
- Create guest list
- Have the tailoring and fitting done
- Shop for dress
- Find caterer
- Cater the wedding
- Wait for RSVPs
- Mail the invitations
- Finalize the menu
- Print the invitations
- Choose the bouquet
Activity List
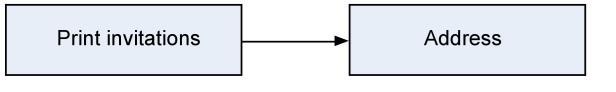
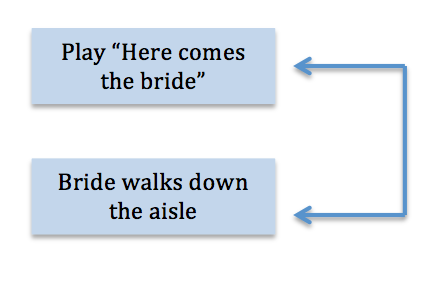
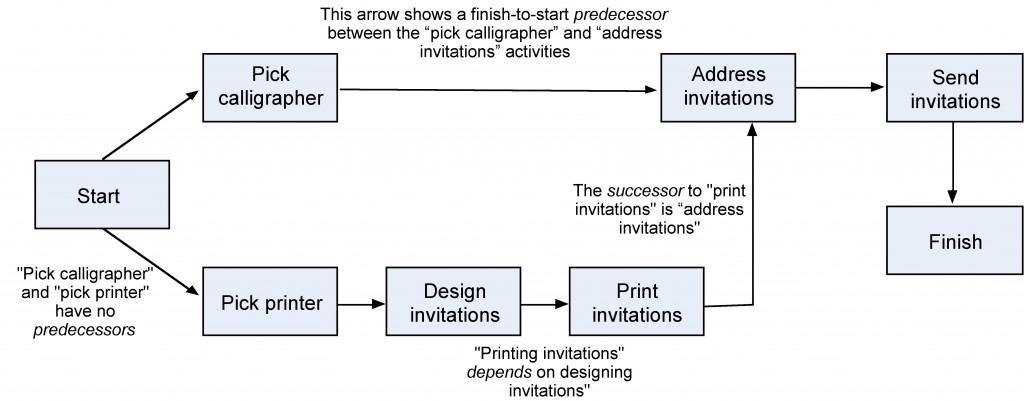
Now that the activity definitions for the work packages have been completed, the next task is to complete the activity list. The project activity list is a list of everything that needs to be done to complete your project, including all the activities that must be accomplished to deliver each work package. Next you want to define the activity attributes. Here’s where the description of each activity is kept. It includes all the information you need to figure out plus the order of the work. Any predecessor activities, successor activities, or constraints should be listed in the attributes along with descriptions and any other information about resources or time that you need for planning. The three main kinds of predecessors are finish-to-start (FS), start-to-start (SS), and finish-to-finish (FF). The most common kind of predecessor is the finish-to-start. It means that one task needs to be completed before another one can start. When you think of predecessors, this is what you usually think of; one thing needs to end before the next can begin. It’s called finish-to-start because the first activity’s finish leads into the second activity’s start (Figure 9.3).
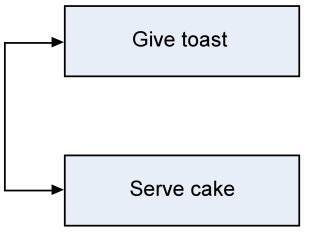
The start-to-start predecessor is a little less common, but sometimes you need to coordinate activities so they begin at the same time (Figure 9.4).
The finish-to-finish predecessor shows activities that finish at the same time (Figure 9.5).
It is possible to have start-to-finish (SF) predecessors. This happens when activities require that another task be started before the successor task can finish. An example might be that the musicians cannot finish playing until the guests have started leaving the ceremony. In addition, there are some particular types of predecessors that must be considered.
External Predecessors
Sometimes your project will depend on things outside the work you’re doing. For the wedding, we are depending on the wedding party before us to be out of the reception hall in time for us to decorate. The decoration of the reception hall then depends on that as an external predecessor.
Discretionary Predecessors
These are usually process- or procedure-driven or best-practice techniques based on past experience. In the wedding example, Steve and Susan want the bridesmaids to arrive at the reception before the couple arrives. There’s no necessity; it is just a matter of preference.
Mandatory Predecessors
You can’t address an invitation that hasn’t been printed yet. So printing invitations is a mandatory predecessor for addressing them. Mandatory predecessors are the kinds that have to exist just because of the nature of the work.
Leads and Lags
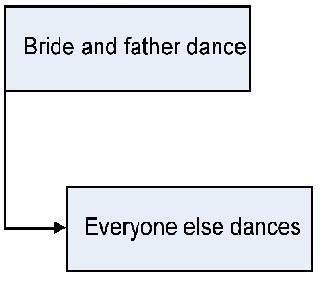
Sometimes you need to give some extra time between activities. Lag time is when you purposefully put a delay between the predecessor task and the successor. For example, when the bride and her father dance, the others wait awhile before they join them (Figure 9.6).
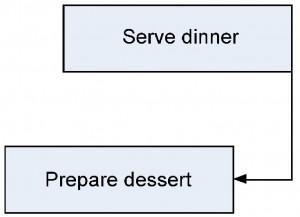
Lead time is when you give a successor task some time to get started before the predecessor finishes (Figure 10.7). So you might want the caterer preparing dessert an hour before everybody is eating dinner.
Milestones
All of the important checkpoints of your project are tracked as milestones. Some of them could be listed in your contract as requirements of successful completion; some could just be significant points in the project that you want to keep track of. The milestone list needs to let everyone know which milestones are required and which are not.
Some milestones for Susan and Steve’s wedding might be:
- Invitations sent
- Menu finalized
- Location booked
- Bridesmaids’ dresses fitted
As you figure out which activities will need to be done, you may realize that the scope needs to change. When that happens, you need to create a change request and send it through the change control system.
Some things that could go wrong:
Steve: The quartet cancelled. They had another wedding that day.
Susan: Aunt Jane is supposed to sing at the service, but after what happened at her uncle’s funeral, I think I want someone else to do it.
Steve: Should we really have a pan flute player? I’m beginning to think it might be overkill.
Susan: Apparently! Maybe we should hold off on printing the invitations until these things are worked out.
Wedding Planner: OK, let’s think about exactly how we want to do this. I think we need to be sure about how we want the service to go before we do any more printing.
The Activity Sequencing Process
Now that we know what we have to do to make the wedding a success, we need to focus on the order of the work. Sally sat down with all of the activities she had defined for the wedding and decided to figure out exactly how they needed to happen. That’s where she used the activity sequencing process.
The activity attribute list Sally created had most of the predecessors and successors necessary written in it. This is where she thought of what comes first, second, third, etc. Sally’s milestone list had major pieces of work written down, and there were a couple of changes to the scope she had discovered along the way that were approved and ready to go.
Example milestone list: Steve and Susan had asked that the invitations be printed at least three months in advance to be sure that everyone had time to RSVP. That’s a milestone on Sally’s list.
Example change request: When Sally realized that Steve and Susan were going to need another limo to take the bridesmaids to the reception hall, she put that change through change control, including running everything by Susan’s mother, and it was approved.
Creating the Gantt chart
A Gantt chart is a type of bar chart, developed by Henry Gantt that illustrates a project schedule. Gantt charts are easy to read and are commonly used to display schedule activities. These charts display the start and finish dates of the terminal elements and summary elements of a project. Terminal elements and summary elements comprise the work breakdown structure of the project. Some Gantt charts also show the dependency relationships (i.e., precedence network) between activities.
Gantt charts show all the key stages of a project and their duration as a bar chart, with the time scale across the top. The key stages are placed on the bar chart in sequence, starting in the top left corner and ending in the bottom right corner (Figure 9.8). A Gantt chart can be drawn quickly and easily and is often the first tool a project manager uses to provide a rough estimate of the time that it will take to complete the key tasks. Sometimes it is useful to start with the target deadline for completion of the whole project, because it is soon apparent if the time scale is too short or unnecessarily long. The detailed Gantt chart is usually constructed after the main objectives have been determined.
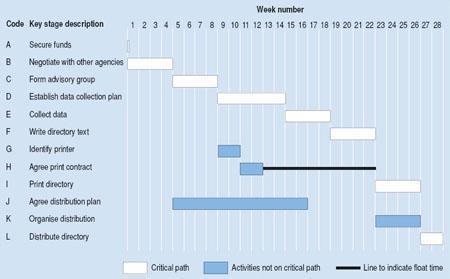
In this example in Figure 9.8, key stage K (Organize distribution) starts at week 23 so that its end point coincides with key stage L (Distribute directory). However, K could begin as early as week 17, as soon as key stage J is completed. Key stage K is therefore said to have “slack.” Key stage H (Agree print contract) has been placed to end at week 12. However, it could end as late as week 22, because key stage I (Print directory) does not begin until week 23. Key stage H is therefore said to have “float.” Float time can be indicated on the chart by adding a line ahead of the bar to the latest possible end point. Slack and float show you where there is flexibility in the schedule, and this can be useful when you need to gain time once the project is up and running.
You can add other information to a Gantt chart, for example:
- Milestones could be indicated by using a symbol such as a diamond or triangle.
- Project meetings could be indicated by another symbol such as a circle.
- Reviews of progress could be indicated by a square.
For a complex project, you may decide to produce a separate Gantt chart for each of the key stages. If you do this shortly before each key stage begins, you will be able to take any last-minute eventualities into account. These charts provide a useful tool for monitoring and control as the project progresses.
Gantt charts are relatively easy to draw by hand, but this doesn’t offer the same level of flexibility during monitoring that you would get from a software package. Various programs are available to assist project managers in scheduling and control. Once the data have been entered, a program helps you to work on “what if” scenarios, showing what might happen if a key stage is delayed or speeded up. This is more difficult if you are working manually.
Creating the Network Diagram
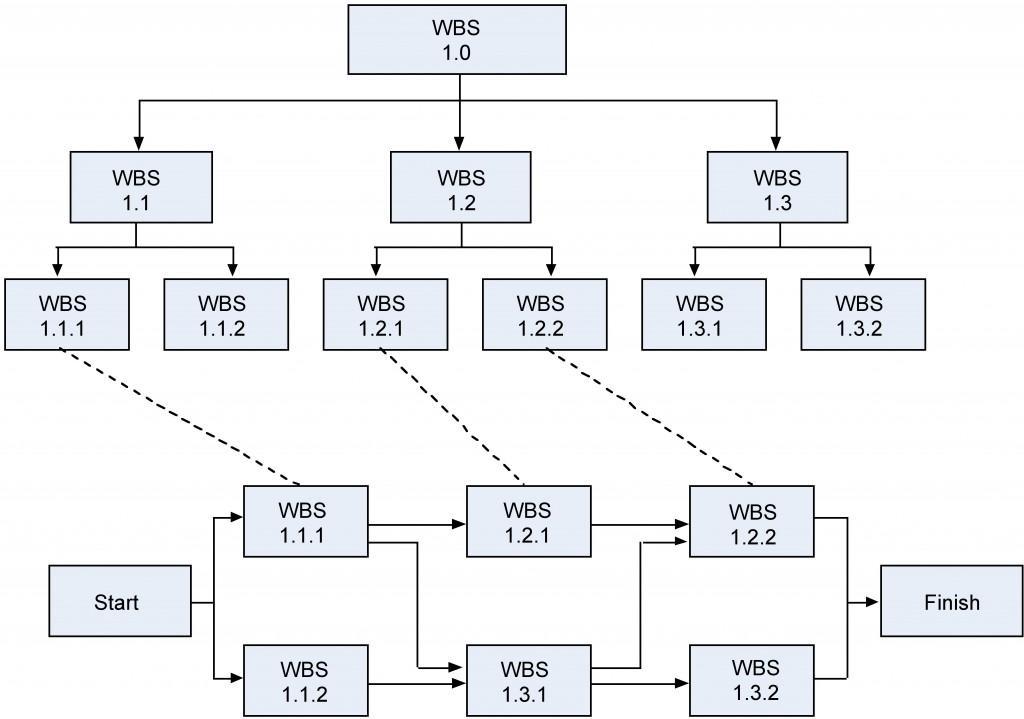
Many project managers use network diagrams when scheduling a project. The network diagram is a way to visualize the interrelationships of project activities. Network diagrams provide a graphical view of the tasks and how they relate to one another. The tasks in the network are the work packages of the WBS. All of the WBS tasks must be included in the network because they have to be accounted for in the schedule. Leaving even one task out of the network could change the overall schedule duration, estimated costs, and resource allocation commitments.
The first step is to arrange the tasks from your WBS into a sequence. Some tasks can be accomplished at any time throughout the project where other tasks depend on input from another task or are constrained by time or resources.(Figure 9.9[2])
The WBS is not a schedule, but it is the basis for it. The network diagram is a schedule but is used primarily to identify key scheduling information that ultimately goes into user-friendly schedule formats, such as milestone and Gantt charts.
The network diagram provides important information to the project team. It provides information about how the tasks are related (Figure 9.9), where the risk points are in the schedule, how long it will take as currently planned to finish the project, and when each task needs to begin and end.
In our wedding planner example, Sally would look for relationships between tasks and determine what can be done in parallel and what activities need to wait for others to complete. As an example, Figure 9.10 shows how the activities involved in producing the invitations depend on one another. Showing the activities in rectangles and their relationships as arrows is called a precedence diagramming method (PDM). This kind of diagram is also called an activity-on-node (AON) diagram.
Another way to show how tasks relate is with the activity-on-arrow (AOA) diagram. Although AON is more commonly used and is supported by all project management programs, PERT is the best-known AOA-type diagram and is the historical basis of all network diagramming. The main difference is the AOA diagram is traditionally drawn using circles as the nodes, with nodes representing the beginning and ending points of the arrows or tasks. In the AOA network, the arrows represent the activities or tasks (Figure 9.11).
All network diagrams have the advantages of showing task interdependencies, start and end times, and the critical path (the longest path through the network) but the AOA network diagram[3] has some disadvantages that limit the use of the method.
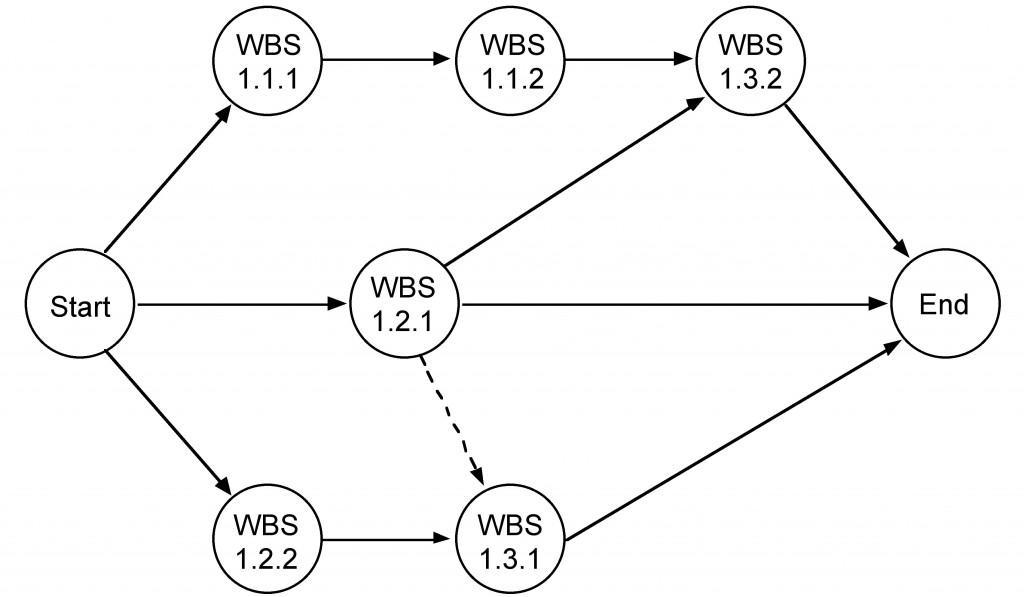
The three major disadvantages of the AOA method are:
- The AOA network can only show finish-to-start relationships. It is not possible to show lead and lag except by adding or subtracting time, which makes project tracking difficult.
- There are instances when dummy activities can occur in an AOA network. Dummy activities are activities that show the dependency of one task on other tasks but for other than technical reasons. For example, one task may depend on another because it would be more cost effective to use the same resources for the two; otherwise the two tasks could be accomplished in parallel. Dummy activities do not have durations associated with them. They simply show that a task has some kind of dependence on another task.
- AOA diagrams are not as widely used as AON diagrams simply because the latter are somewhat simpler to use, and all project management software programs can accommodate AON networks, whereas not all can accommodate AOA networks.
The Critical Path
The critical path is the longest path through the project, and any delays along it will delay completion of the entire project. In this sense, there is zero slack time within the critical path. It is based on the idea that some tasks must be completed before others can begin, thus while some task can be sequenced with much flexibility, critical path tasks are locked in by task relationships . A critical path diagram is a useful tool for scheduling dependencies and controlling a project. In order to identify the critical path, the length of time that each task will take must be calculated.
Let’s take a look at an example. The length of time in weeks for each key stage is estimated:[4]
|
|
Key stage |
Estimated time in weeks |
|
A |
Secure funds |
0 |
|
B |
Negotiate with other agencies |
4 |
|
C |
Form advisory group |
4 |
|
D |
Establish data collection plan |
6 |
|
E |
Collect data |
4 |
|
F |
Write directory text |
4 |
|
G |
Identify printer |
2 |
|
H |
Agree print contract |
2 |
|
I |
Print directory |
4 |
|
J |
Agree distribution plan |
12 |
|
K |
Organize distribution |
4 |
|
L |
Distribute directory |
2 |
We have given the key stage “Secure funds” an estimated time of zero weeks because the project cannot start without the availability of some funding, although estimates would provide detail at a later stage. The stages can now be lined up to produce a network diagram that shows that there are three paths from start to finish and that the lines making up each path have a minimum duration (Figure 9.12).
If we now trace each of the possible paths to “Distribute directory” (the finishing point), taking dependencies into account, the route that has the longest duration is known as the critical path. This is the minimum time in which it will be possible to complete the project.
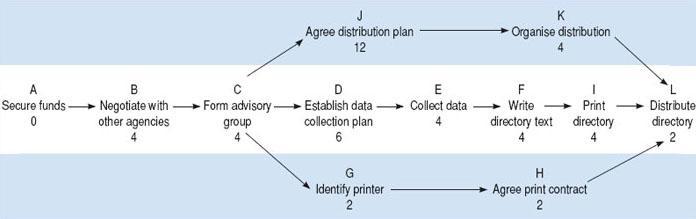
In this example, the critical path is A–B–C–D–E–F–I–L, and the earliest completion date for the project is the sum of the estimated times for all the stages on the critical path – 28 weeks – from the point of securing the funding. All the key stages on the critical path must be completed on time if the project is to be finished on schedule.
If the projected total time is much longer than the project sponsor’s expectations, you will need to renegotiate the time scale. Mapping the critical path helps to identify the activities that need to be monitored most closely.
Optimize the schedule
Optimizing the schedule is the final step in the process where the project manager and team take a very critical look at the draft schedule and seek ways to improve it-that is, to make it more accurate, more realistic, more effective and faster.
Using Scheduling Software
There are different software packages available to the project manager and team to assist them in developing and managing the project schedule. To decide which software best meets your needs do your research and get recommendations from other users. However, ensure that the software is a good fit for you.
Any project planning software must do the following:
- Handle developments and changes to the Gantt charts and network diagrams and be able to calculate the critical path
- Produce schedules and budgets
- Integrate project schedules with calendar allowing for weekends and holidays
- Create “what if” scenarios for contingency planning and updating
- Check for overscheduling of individuals and groups.
Key Takeaways
- Activities are the individual units of work that must be completed to fulfill the deliverables. They are not the deliverables themselves.
- Once all the tasks and sub-tasks have been identified, examine the relationships between tasks to see which must follow a particular sequence and which can be worked in parallel.
- A draft project schedule includes the start and completion dates of all activities, recognizes task duration, and illustrates the dependencies between tasks.
- Gantt charts provides a useful visualization of project status, estimated project and task duration, and task sequences, but they do not reflect underlying task dependencies or critical path.
- The critical path is critical because every single activity on the path must finish on time in order for the project to come in on time. It is the longest path through a project. It represents the total project duration. A delay in any one of the critical path activities will cause the entire project to be delayed.
- Network diagrams shows activities and task graphically in order that they should be accomplished. They illustrates task relationships and connectors in terms of predecessors and successors, which creates the idea of “dependencies” between work packages. Dependencies are often the results of constraints.
- There are advantages and disadvantages for using Gantt charts and Network diagrams.
- Slack is the amount of time a task could be delayed without delaying the completion of the project.
Attribution
This chapter is based on chapter 10 in Project Management by Adrienne Watt.
Chapter 10 in Project Management by Adrienne Watt CC BY 4.0 is a derivative the following texts:
- Project Management by Merrie Barron and Andrew Barron. © CC BY (Attribution).
- Gantt Chart by Wikipedia. © CC BY-SA (Attribution-ShareAlike).
- Planning a Project by OpenLearn Labspace. © CC BY-NC-SA (Attribution-NonCommercial-ShareAlike).
Media Attributions
- Wedding WBS Exercises © Barron & Barron Project Management for Scientists and Engineers is licensed under a CC BY (Attribution) license
- Wedding WBS Exercises Solution © Barron & Barron Project Management for Scientists and Engineers is licensed under a CC BY (Attribution) license
- FS Predecessor © Barron & Barron Project Management for Scientists and Engineers is licensed under a CC BY (Attribution) license
- SS Predecessor © Barron & Barron Project Management for Scientists and Engineers is licensed under a CC BY (Attribution) license
- FF Predecessor © Barron & Barron Project Management for Scientists and Engineers is licensed under a CC BY (Attribution) license
- WBS Lag © Barron & Barron Project Management for Scientists and Engineers is licensed under a CC BY (Attribution) license
- WBS Lead © Barron & Barron Project Management for Scientists and Engineers is licensed under a CC BY (Attribution) license
- Gantt Chart © Open University is licensed under a CC BY-NC-SA (Attribution NonCommercial ShareAlike) license
- WBS and Network Diagram © Barron & Barron Project Management for Scientists and Engineers is licensed under a CC BY (Attribution) license
- AON Diagram © Barron & Barron Project Management for Scientists and Engineers is licensed under a CC BY (Attribution) license
- Wedding WBS Exercises and Wedding WBS Exercises Solution © Barron & Barron Project Management for Scientists and Engineers is licensed under a CC BY (Attribution) license ↵
- Illustration from Barron & Barron Project Management for Scientists and Engineers, http://cnx.org/content/col11120/1.4/ ↵
- Illustration from Barron & Barron Project Management for Scientists and Engineers, http://cnx.org/content/col11120/1.4/ ↵
- Source: http://labspace.open.ac.uk/mod/resource/view.php?id=451674 ↵
