
Criminal Activity
Learning Outcomes
- Identify and differentiate types of crimes
- Evaluate U.S. crime statistics

Although deviance is a violation of social norms, it’s not always punishable, and it’s not necessarily bad. Crime, on the other hand, is a behavior that violates official law and is punishable through formal sanctions. Walking to class backward is a deviant behavior. Driving with a blood alcohol percentage over the state’s limit is a crime. Like other forms of deviance, however, ambiguity exists concerning what constitutes a crime and whether all crimes are, in fact, “bad” and deserve punishment.
As you have learned, all societies have informal and formal ways of maintaining social control. Within these systems of norms, societies have legal codes that maintain formal social control through laws, which are rules adopted and enforced by a political authority. Those who violate these rules incur negative formal sanctions. Normally, punishments are relative to the degree of the crime and the importance to society of the value underlying the law. As we will see, however, there are other factors that influence criminal sentencing.
Types of Crimes
Not all crimes are given equal weight. Society generally socializes its members to view certain crimes as more severe than others. For example, most people would consider murdering someone to be far worse than stealing a wallet and would expect a murderer to be punished more severely than a thief. In modern U.S. society, crimes are classified as one of two types based on their severity. Violent crimes (also known as “crimes against a person”) are based on the use of force or the threat of force. Rape, murder, and armed robbery fall under this category. Nonviolent crimes involve the destruction or theft of property but do not use force or the threat of force. Because of this, they are also sometimes called “property crimes.” Larceny, car theft, and vandalism are all types of nonviolent crimes. If you use a crowbar to break into a car, you are committing a nonviolent crime; if you mug someone with the crowbar, you are committing a violent crime.
We discussed the differences between street crime, or offenses committed by ordinary people against other people or organizations, usually in public spaces, and corporate crime, or white-collar crime, which are committed by workers in a business environment. Embezzlement, insider trading, and identity theft are all types of corporate crime.
An often-debated third type of crime is victimless crime. Crimes are called victimless when the perpetrator is not explicitly harming another person. As opposed to battery or theft, which clearly have a victim, a crime like drinking a beer when someone is twenty years old or selling a sexual act do not result in injury to anyone other than the individual who engages in them, although they are illegal. While some claim acts like these are victimless, others argue that they actually do harm society. Prostitution may foster abuse toward women by clients or pimps. Drug use may increase the likelihood of employee absences. Such debates highlight how the deviant and criminal nature of actions develops through ongoing public discussion.
Try It
Hate Crimes
The term “hate crime” refers to a “criminal offense against a person or property motivated in whole or in part by an offender’s bias against a race, religion, disability, sexual orientation, ethnicity, gender, or gender identity.”[1] Hate itself is not a crime—and the FBI is mindful of protecting freedom of speech and other civil liberties.

From Roman persecution of Christians in the 1st century AD, to 6 million people, predominantly Jews, killed in the Holocaust in the 20th century, we find many examples of hate crimes. When hate crimes are state-sponsored, such as the Holocaust, the Indian Removal Act (1830), or slavery in the U.S. (1619-1865), we can see the state’s efforts to eliminate legal rights and deny citizen rights to certain people. The Nuremberg laws were enacted in Germany in 1935, which stripped Jews of any citizenship rights. In Dred Scott v. Sanford (1857), the U.S. Supreme Court decided that an African American did not qualify as a U.S. citizen and effectively said that even Blacks in free territories had no rights and were still legally the property of white slaveowners. A series of laws and Supreme Court decisions in the 18th and 19th centuries rendered Native Americans landless and stripped them of citizenship rights, which allowed the U.S. government to take land from them with impunity.
In a contemporary context, reports of hate crimes have increased steadily since 2016. The FBI has been investigating hate crimes in the U.S. since World War I, but like many violent crimes, much of the available statistical data depends on how crimes are categorized and whether hate crimes are reported at all. Orlando, Florida reported just five (5) hate crimes in 2017. In 2016, a gay nightclub in Orlando, was the site of one of the deadliest mass shootings in U.S. history with 49 dead and 53 wounded, but is not included in the 2016 Florida Hate Crimes Report. Testimony by the shooter Omar Mateen’s wife seemed to affirm the fact that it was a terrorist act, but that the site was not chosen because of its LGBTQ population, but rather out of convenience and lack of security (the initial target being Disney Springs, which has far more security).[2]
A white man opened fire inside a historically Black church in Charleston, South Carolina, killing nine people in 2015. He was immediately charged with a hate crime and confessed to the shootings the morning after in hopes of starting a race war[3] (Wikipedia). South Carolina is one of a handful of states with no hate crime laws, so he was charged with nine counts of murder in South Carolina but also was tried in federal court and convicted of 33 federal hate crime and murder charges and sentenced to death.

Crime Statistics
The FBI gathers data from approximately 17,000 law enforcement agencies, and the Uniform Crime Reports (UCR) is the annual publication of this data (FBI 2011). The UCR has comprehensive information from police reports but fails to account for the many crimes that go unreported, often due to victims’ fear, shame, or distrust of the police. The quality of this data is also inconsistent because of differences in approaches to gathering victim data; important details are not always asked for or reported (Cantor and Lynch 2000).
Due to these issues, the U.S. Bureau of Justice Statistics publishes a separate self-report study known as the National Crime Victimization Report (NCVR). A self-report study is a collection of data gathered using voluntary response methods, such as questionnaires or telephone interviews. Self-report data are gathered each year, asking approximately 160,000 people in the United States about the frequency and types of crime they’ve experienced in their daily lives (BJS 2013). The NCVR reports a higher rate of crime than the UCR, likely picking up information on crimes that were experienced but never reported to the police. Age, race, gender, location, and income-level demographics are also analyzed (National Archive of Criminal Justice Data 2010).
The NCVR survey format allows people to more openly discuss their experiences and also provides a more-detailed examination of crimes, which may include information about consequences, relationship between victim and criminal, and substance abuse involved. One disadvantage is that the NCVR misses some groups of people, such as those who don’t have telephones and those who move frequently. The quality of information may also be reduced by inaccurate victim recall of the crime (Cantor and Lynch 2000).
Public Perception of Crime
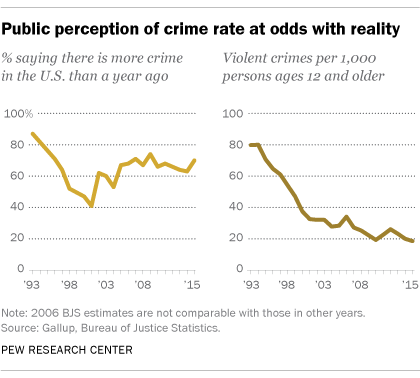
Neither the NCVR nor the UCR accounts for all crime in the United States, but general trends can be determined. Crime rates, particularly for violent and gun-related crimes, have been on the decline since peaking in the early 1990s (Cohn, Taylor, Lopez, Gallagher, Parker, and Maass 2013). However, the public believes crime rates are still high, or even worsening. Recent surveys (Saad 2011; Pew Research Center 2013, cited in Overburg and Hoyer 2013) have found U.S. adults believe crime is worse now than it was twenty years ago.
Inaccurate public perception of crime may be heightened by popular crime shows such as CSI, Criminal Minds and Law & Order (Warr 2008) and by extensive and repeated media coverage of crime. Many researchers have found that people who closely follow media reports of crime are likely to estimate the crime rate as inaccurately high and more likely to feel fearful about the chances of experiencing crime (Chiricos, Padgett, and Gertz 2000). Recent research has also found that people who reported watching news coverage of 9/11 or the Boston Marathon Bombing for more than an hour daily became more fearful of future terrorism (Holman, Garfin, and Silver 2014).
Further Research
How is crime data collected in the United States? Read about the methods of data collection and take the National Crime Victimization Survey.
Think It Over
- How are crime statistics used by politicians to sway voters?
Try It
Glossary
- corporate crime:
- crime committed by white-collar workers in a business environment
- corrections system:
- the system tasked with supervising individuals who have been arrested for, convicted of, or sentenced for criminal offenses
- crime:
- a behavior that violates official law and is punishable through formal sanctions
- hate crimes:
- attacks based on a person’s race, religion, or other characteristics
- legal codes:
- codes that maintain formal social control through laws
- nonviolent crimes:
- crimes that involve the destruction or theft of property, but do not use force or the threat of force
- self-report study:
- a collection of data acquired using voluntary response methods, such as questionnaires or telephone interviews
- street crime:
- crime committed by average people against other people or organizations, usually in public spaces
- victimless crime:
- activities against the law, but that do not result in injury to any individual other than the person who engages in them
- violent crimes:
- crimes based on the use of force or the threat of force
<a style="margin-left: 16px;" href="https://docs.google.com/document/d/1vy-T6DtTF-BbMfpVEI7VP_R7w2A4anzYZLXR8Pk4Fu4" target="_blank"
- What we investigate: Hate crimes. (2017). FBI. https://www.fbi.gov/investigate/civil-rights/hate-crimes ↵
- Jeltsen, M. 2018. How everyone got the pulse massacre completely wrong. https://www.huffingtonpost.com/entry/noor-salman-pulse-massacre-wrong_us_5ac29ebae4b04646b6454dc2 ↵
- Charleston church shooting. Wikipedia. https://en.wikipedia.org/wiki/Charleston_church_shooting ↵
