15.5 Activation Energy and the Arrhenius Equation
Learning Objectives
- To gain an understanding of activation energy.
- To determine activation energy graphically or algebraically.

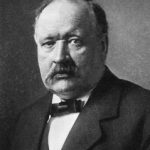
Earlier in the chapter, reactions were discussed in terms of effective collision frequency and molecule energy levels. In 1889, a Swedish scientist named Svante Arrhenius proposed an equation that relates these concepts with the rate constant:
k = Ae-Ea/RT
where k represents the rate constant, Ea is the activation energy, R is the gas constant (8.3145 J/K mol), and T is the temperature expressed in Kelvin. A is known as the frequency factor, having units of L mol-1 s-1, and takes into account the frequency of reactions and likelihood of correct molecular orientation.
The Arrhenius equation allows us to calculate activation energies if the rate constant is known, or vice versa. As well, it mathematically expresses the relationships we established earlier: as activation energy term Ea increases, the rate constant k decreases and therefore the rate of reaction decreases.
Determining the Activation Energy
Graphically
We can graphically determine the activation energy by manipulating the Arrhenius equation to put it into the form of a straight line. Taking the natural logarithm of both sides gives us:
ln k = -(Ea/RT) + ln A
A slight rearrangement of this equation then gives us a straight line plot (y = mx + b) for ln k versus 1/T, where the slope is –Ea/R:
ln k = – (Ea/R)(1/t) + ln A
Example 7
Using the data from the following table, determine the activation energy of the reaction:
| Temperature (K) | Rate Constant, k (s-1) |
| 375 | 1.68 x 10⁻⁵ |
| 400 | 3.5 x 10⁻⁵ |
| 500 | 4.2 x 10⁻⁴ |
| 600 | 2.11 x 10⁻³ |
Solution
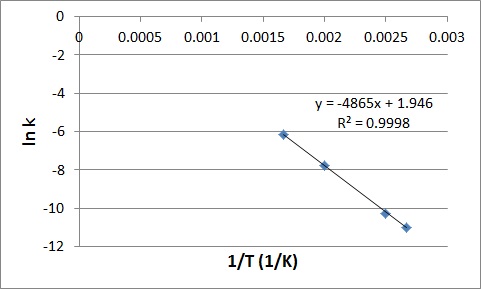
We can obtain the activation energy by plotting ln k versus 1/T, knowing that the slope will be equal to –(Ea/R).
First determine the values of ln k and 1/T, and plot them in a graph:
| 1/T | ln k |
|
0.002667 |
-10.9941 |
|
0.0025 |
-10.2602 |
|
0.002 |
-7.77526 |
|
0.001667 |
-6.16107 |

Slope = – (Ea/R)
-4865 K = – Ea/(8.3145 J K-1 mol-1)
Ea = 4.0 x 10⁴ J/mol
Algebraically
The activation energy can also be calculated algebraically if k is known at two different temperatures:
At temperature 1: ln k1 = -(Ea/RT1) + ln A
At temperature 2: ln k2 = -(Ea/RT2) + ln A
We can subtract one of these equations from the other:
ln k1 – ln k2 = {-(Ea/RT1) + ln A} – {-(Ea/RT2) + ln A}
This equation can then be further simplified to:
ln (k1/k2) = (Ea/R){(1/T2)-(1/T1)}
Example 8
Determine the value of Ea given the following values of k at the temperatures indicated:
600 K: k = 2.75 x 10⁻⁸ L mol-1 s-1
800 K: k = 1.95 x 10⁻⁷ L mol-1 s-1
Solution
Substitute the values stated into the algebraic method equation:
ln (k1/k2) = (Ea/R){(1/T2)-(1/T1)}
ln (2.75 x 10⁻⁸ L mol-1 s-1/1.95 x 10-7 L mol-1 s-1) = (Ea/8.3145 J K-1 mol-1){(1/800K)-(1/600K)}
1.96 = (Ea/8.3145 J K-1 mol-1)(-4.16 x 10⁻⁴ K-1 )
4.704 x 10⁻³ K-1 = Ea/8.3145 J K-1 mol-1
Ea = 3.92 x 10⁴ J/mol
Key Takeaways
- The activation energy can be graphically determined by manipulating the Arrhenius equation.
- The activation energy can also be calculated algebraically if k is known at two different temperatures.

