
Reading: Challenges in the Product Life Cycle
In theory, the product life cycle follows a predictable path that is easy to understand. This might suggest that the marketer just needs to gear up for the ride and be ready to adjust tactics as the product moves through its life cycle. On the contrary, a marketer’s job is much less passive—instead, the marketer’s goal is to influence the life cycle. An effective marketer tries to extend the growth stage in order to maximize revenue and profits and to extend the maturity stage in order to fund the development and introduction of new products.
Apple’s iPod Life-Cycle Strategies
It is easier to understand the complexity of the product life cycle in the context of a real-life example. The total sales of Apple’s iPod across all models follow a classic product life-cycle curve (see Figure 1[1] below).

Remember, these data include all models of iPods. One strategy that Apple employs to increase growth is to introduce new product models often. They used this strategy during the popularity of iPods; the new models had fairly similar functions but offered significantly different styling. This drove multiple sales to the same buyer. A buyer was less likely to say, “I already have an iPod,” than to say, “I have an iPod Classic but I want an iPod Nano.” From the initial launch in October 2002 through 2007, Apple introduced five major iPod models, with multiple versions of each.[2] The graph below shows the sequence of releases, with large dots representing the initial release of each new model. In September of 2008 and 2010, Apple released new versions of three different iPod models at the same time.

Apple’s rapid product releases kept it on the cutting edge of design and made it difficult for competitors to take market share during the product’s growth stage. In September 2006, Apple CEO Steve Jobs reported that iPods held a 75.6 percent market share.
Throughout the growth period, Apple chose not to sell old versions of new devices. Once the company introduced the third generation of the iPod Nano, it stopped selling new second-generation iPod Nanos (though it did still offer refurbished versions of the older products). This allowed the company to quickly make the older versions obsolete, which drove new sales and reduced the ongoing support costs for older models.
When companies talk about “cannibalizing” their market, they mean that one product takes market share from another. In effect, one of the company’s products is eating the other product’s market share. Each new model of the iPod took market share from its predecessors, but collectively the iPod products dominated their market. The greatest cannibal of all in the Apple story is the iPhone, which was first released in June 2007.
The Smartphone Product Life Cycle
A smartphone is a mobile phone that performs many of the same functions as a computer. Prior to the introduction of the smartphone, most people used cell phones—which are now referred to as “feature phones.” Feature phones provide phone and text capabilities but lack an operating system that can support the more advanced capabilities of today’s smartphones.
Early smartphones saw broad adoption in Japan in 2001, but mass adoption of smartphones did not reach the U.S. until business users fell in love with the Blackberry in 2003. Today, smartphones from a range of providers use primarily Google’s Android operating system, Apple’s iOS, or Microsoft Mobile.
Global sales of smartphones have grown rapidly, as shown in Figure 3[3] below.
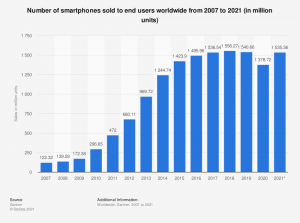
Marketers are using many different strategies to drive the growth of smartphones, but perhaps the greatest impact has been the opening of the technology platform to allow other vendors to offer applications for them. Apple, Samsung, Microsoft, and other players have not tried to imagine every possible use for a smartphone and build it themselves. Instead, they have created the technology infrastructure and an open marketplace for applications. Programmers can develop applications that can run on any phone, and smartphone owners can select and buy the apps that are of interest.
Through this broad range of applications, the smartphone brings together a number of different functions on one device. Before the first release of the smartphone, many people carried a feature phone to answer calls and a personal digital assistant to manage email and calendars. With the smartphone, these two functions came together, and as the device has matured, it has taken over many other tasks that were formerly performed on a separate device.
The adoption of smartphones has had a tremendous impact on the product life cycle of a range of other products. When Apple introduced the iPhone in 2007, the company was cannibalizing its market for iPods. Today, most Apple customers play their media on a phone rather than on a separate media-dedicated device. There are still sales of iPods, but the company, in effect, initiated the decline of the market with its own introduction of the iPhone—a market in which it had more than 75 percent market share.
The markets for digital cameras (especially the low-end models) and personal navigation systems (GPS systems) have also been impacted. The product life-cycle graph for digital camera purchases, shown in Figure 4,[4] below, shows a striking resemblance to that of the iPod.

While in the past, smartphone cameras have lagged behind digital cameras in terms of features and performance, they provided two distinct benefits:
- The smartphone adds the camera to an existing device that the user already carries with him
- The smartphone makes it easier to use and share photos through other applications on the phone
With the technological improvements made to smartphone cameras in recent years, those two distinct benefits have become amplified. Smartphones are a dominant factor in the product life cycle of digital cameras, iPods, and a number of other products.
Lessons from the Smartphone Life Cycle
This example shows some benefits of considering the product life cycle in marketing strategies but also some significant limitations.
The product life cycle is not forward-looking. At any point on the graph, a marketer can see what has already occurred but not what is ahead. In planning a product strategy, it is important to understand the past sales performance of the product and the industry broadly, but the role of marketing is to shape future performance, and the product life cycle doesn’t offer many tools to inform that proactive work.
The product life cycle can focus a marketer on a defined set of products and competitors in the current market—but miss broad trends or innovations in adjacent markets and products. A marketer looking for the next feature to add to a digital camera to extend the maturity phase could easily miss the impact that the smartphone would have on the digital camera market. We can learn from Apple’s description of a product marketing manager position in its own company: One of the product marketing manager’s responsibilities is to “closely follow emerging technology, consumer, and societal trends and make recommendations for how products will leverage or fit into those emerging trends.” This broad view is critical to successful marketing.
Finally, this example demonstrates the importance of creating a diverse set of products. When the iPod lost market share to the iPhone, Apple won. Other companies that have lost market on account of the transition to smartphones—Nikon and Canon in cameras, Garmin in navigation devices, etc.—have not fared as well.
- Statista Research Department. (2014, October 7). Apple: iPod sales worldwide 2006-2014. Statista. https://www.statista.com/statistics/276307/global-apple-ipod-sales-since-fiscal-year-2006 ↵
- Richter, F. (2019, May 29). Statista. The slow goodbye of Apple's former cash cow. https://www.statista.com/chart/10469/apple-ipod-sales/ ↵
- O'Dea, S. (2021, March 31). Global smartphone sales to end-users 2007-2021. Statista. https://www.statista.com/statistics/263437/global-smartphone-sales-to-end-users-since-2007/ ↵
- Statista Research Department. (2021, April 21). CIPA companies: shipments of digital cameras 1999-2021. Statista. https://www.statista.com/statistics/264337/cipa-companies-shipments-of-digital-cameras-since-1999/ ↵
