
Reading: The Product Portfolio
Throughout this course, we have discussed a number of ways that organizations market products successfully. How does an organization decide which products to offer? When should a company add new products, and when should it discontinue existing ones? Product portfolio management answers these questions.
Organizing for Effective Product Marketing
Before we dive into the product portfolio it is important to understand how products are organized in most businesses.
Typically, organizations group like products into product lines, and then group lines of business targeting a common set of customers into something called strategic business units (SBUs).
A product line is a group of products marketed by an organization to one general market. The products have some characteristics, customers, and uses in common, and may also share technologies, distribution channels, prices, services, etc. There are often product lines within product lines.[1]
Before we take a look at an example, let’s review some definitions within product organizations:
-
- A product is a bundle of attributes (features, functions, benefits, and uses) that a person receives in an exchange. In essence, the term “product” refers to anything offered by a firm to provide customer satisfaction—tangible or intangible. Thus, a product may be an idea (recycling), a physical good (a pair of jeans), a service (banking), or any combination of the three.
- An example of a product is Tylenol pain reliever.
- A product line is a group of products marketed by an organization to one general market. The products have some characteristics, customers, and/or uses in common, and may also share technologies, distribution channels, prices, services, etc. There are often product lines within product lines.
- An example of a product line is the full range of Tylenol products.
- A strategic business unit or SBU is a self-contained planning unit for which discrete business strategies can be developed.
- An example of a strategic business unit is consumer health care products.
- A product is a bundle of attributes (features, functions, benefits, and uses) that a person receives in an exchange. In essence, the term “product” refers to anything offered by a firm to provide customer satisfaction—tangible or intangible. Thus, a product may be an idea (recycling), a physical good (a pair of jeans), a service (banking), or any combination of the three.
Johnson & Johnson
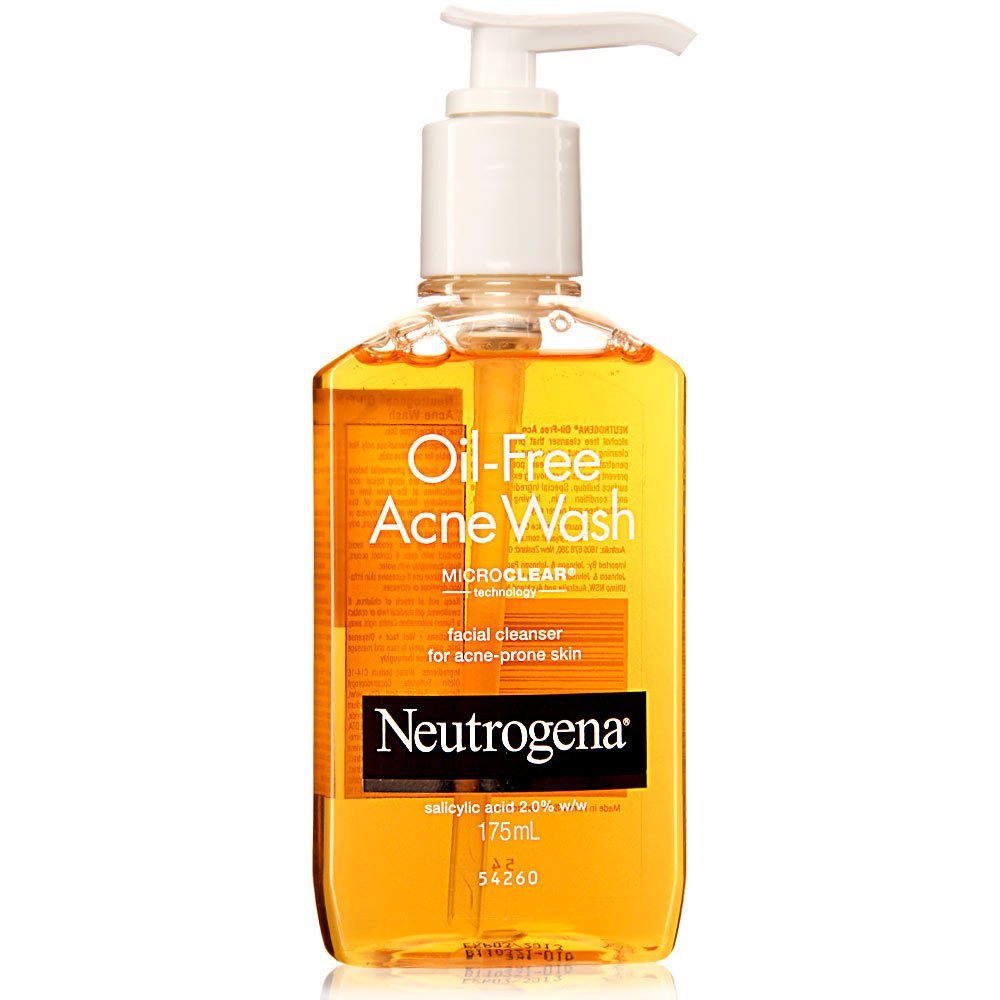 Johnson & Johnson has hundreds of products. They sell baby shampoo to new parents and knee systems to surgeons who perform knee replacement surgeries. Imagine trying to understand all of the different products and their target buyers. It would be impossible to span all of those products well. At the same time, what if your organization owns a single product—say, Johnson & Johnson’s Neutrogena face wash? A different organization owns Johnson & Johnson’s Aveeno face wash. It would be easy to optimize for a single product, rather than trying to achieve company objectives across all the products.
And as for a product line inside a product line? Johnson & Johnson has a product line of skin and hair care products. Within that product line, there are a number of brands that have a set of complementary products. Returning to our previous example, the Neutrogena product line includes a complete set of dermatologist-recommended skin and hair care products. The Aveeno product line includes a complete set of natural skincare products. Neutrogena products target buyers who place greater trust doctors, and Aveeno targets buyers who trust natural products, but both are part of the Johnson & Johnson skin and hair care product line.
The skin and hair care product line is part of a larger strategic business unit for Johnson & Johnson: the consumer health care products business unit. This SBU includes:
- baby care
- skin and hair care
- wound care and topicals
- oral health care
- over-the-counter medicines
- vision care
- nutritionals
Think about this list. There are differences in the target buyer for each product line, but drugstores like Shoppers Drug Mart and Lawtons Drugs carry all of these products, and they are, of course, all targeting consumers.
Johnson & Johnson’s other SBUs include medical devices and prescription products.
Managing the Product Portfolio
The goal of product portfolio management is to ensure that the company’s investment in products meets objectives. In order to do this, portfolio management must understand the needs and contributions of the products and allocate resources across product lines and SBUs to optimize their market performance.
Analyzing SBU Performance
Should Johnson & Johnson invest equally in all of its SBUs and product lines? The table below shows Johnson & Johnson’s 2014 financial results.[2]
| SBU | 2014 revenue | Revenue growth from 2013 | % profit | Research and Development spending |
|---|---|---|---|---|
| Consumer health care | $14.5 billion | 1% | 13.4% | $629 million |
| Medical devices | $27.5 billion | 1.6% | 28.9% | $1.7 billion |
| Prescription products | $32.3 billion | 16.5% | 36.2% | $6.2 billion |
You can see that Johnson & Johnson is spending ten times more on research and development (R&D) for prescription products than for consumer health care products. Given the higher growth rates and profit margins for prescription products, this looks like a good decision.
Within the SBUs, managers also make important decisions about where to invest. For example, in 2013, the lowest-growth product line in medical devices was diagnostics, which decreased by 8.9 percent from 2012 to 2013. In 2014, Johnson & Johnson sold a major diagnostic product from that product line to another company for $4 billion. This eliminated a product that was not contributing to the portfolio objectives, and it generated new capital that could be invested in higher-growth product lines.
The examples here demonstrate a simple review of SBU performance, but companies can also perform a deep analysis of an SBU and product performance in order to understand past performance and identify future growth opportunities.
Analyzing Market Opportunities
Beyond the internal performance data, portfolio analysis considers broader market factors. In the marketing planning module, we discussed the Boston Consulting Group’s growth-share matrix, which is a tool to used analyze the product portfolio. You’ll recall that this model considers the attractiveness of the market by studying the growth potential in the market, and it includes company performance by showing the product’s current market share. These are both important factors to consider in determining future growth opportunities.

In its annual report, Johnson & Johnson shared the following information with investors about its largest prescription-drug product line:
Immunology products achieved sales of $10.2 billion in 2014, representing an increase of 10.9 percent as compared to the prior year. The increased sales of STELARA® (ustekinumab) and SIMPONI® /SIMPONI ARIA® (golimumab) were primarily due to market growth and market share gains. REMICADE® (infliximab) growth was primarily due to market growth.
A very simplistic analysis of this information suggests that Stelara and Simponi are stars (high market growth and high market share) while Remicade is a question mark. It is benefiting from market growth but is not achieving gains in market share.
Knowing about the product life cycle is also important to understanding market growth. During the introduction phase, the market growth rate is low, and the longer-term potential is unknown. As the market moves into the growth phase, it moves up the market growth axis and creates opportunities for products that are gaining market share and becoming stars. Those that don’t perform well in gaining market share will become question marks. As the market moves into maturity and decline, the market growth moves back down the axis and products will become either cash cows or dogs.

If we add the data from the iPod product life cycle to the growth-share matrix, as shown above, we can see how Apple’s products might be analyzed. In the growth-share matrix, the size of the product sphere is determined by the total sales. Obviously, this diagram is not perfectly sized, but it gives a picture of the way in which product life cycle can be used to inform product portfolio management.
- American Marketing Association.(n.d.). AMA Definitions of marketing. https://www.ama.org/the-definition-of-marketing-what-is-marketing/ ↵
- Johnson & Johnson. (2015, January 20). Johnson & Johnson reports 2014 fourth-quarter and full-year results. https://www.jnj.com/media-center/press-releases/johnson-johnson-reports-2014-fourth-quarter-and-full-year-results ↵
