
107 Catalysis
[latexpage]
Learning Objectives
By the end of this section, you will be able to:
- Explain the function of a catalyst in terms of reaction mechanisms and potential energy diagrams
- List examples of catalysis in natural and industrial processes
Catalysts Do Not Affect Equilibrium
A catalyst can speed up the rate of a reaction. Though this increase in reaction rate may cause a system to reach equilibrium more quickly (by speeding up the forward and reverse reactions), a catalyst has no effect on the value of an equilibrium constant nor on equilibrium concentrations.
The interplay of changes in concentration or pressure, temperature, and the lack of an influence of a catalyst on a chemical equilibrium is illustrated in the industrial synthesis of ammonia from nitrogen and hydrogen according to the equation
A large quantity of ammonia is manufactured by this reaction. Each year, ammonia is among the top 10 chemicals, by mass, manufactured in the world. About 2 billion pounds are manufactured in the United States each year.
Ammonia plays a vital role in our global economy. It is used in the production of fertilizers and is, itself, an important fertilizer for the growth of corn, cotton, and other crops. Large quantities of ammonia are converted to nitric acid, which plays an important role in the production of fertilizers, explosives, plastics, dyes, and fibers, and is also used in the steel industry.
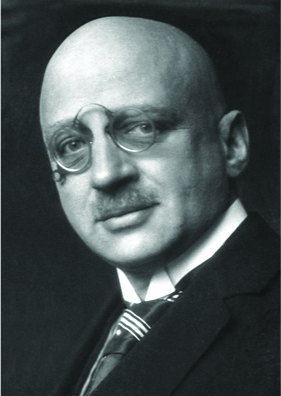
In the early 20th century, German chemist Fritz Haber ((Figure)) developed a practical process for converting diatomic nitrogen, which cannot be used by plants as a nutrient, to ammonia, a form of nitrogen that is easiest for plants to absorb.
The availability of nitrogen is a strong limiting factor to the growth of plants. Despite accounting for 78% of air, diatomic nitrogen (N2) is nutritionally unavailable due the tremendous stability of the nitrogen-nitrogen triple bond. For plants to use atmospheric nitrogen, the nitrogen must be converted to a more bioavailable form (this conversion is called nitrogen fixation).
Haber was born in Breslau, Prussia (presently Wroclaw, Poland) in December 1868. He went on to study chemistry and, while at the University of Karlsruhe, he developed what would later be known as the Haber process: the catalytic formation of ammonia from hydrogen and atmospheric nitrogen under high temperatures and pressures. For this work, Haber was awarded the 1918 Nobel Prize in Chemistry for synthesis of ammonia from its elements. The Haber process was a boon to agriculture, as it allowed the production of fertilizers to no longer be dependent on mined feed stocks such as sodium nitrate. Currently, the annual production of synthetic nitrogen fertilizers exceeds 100 million tons and synthetic fertilizer production has increased the number of humans that arable land can support from 1.9 persons per hectare in 1908 to 4.3 in 2008.
In addition to his work in ammonia production, Haber is also remembered by history as one of the fathers of chemical warfare. During World War I, he played a major role in the development of poisonous gases used for trench warfare. Regarding his role in these developments, Haber said, “During peace time a scientist belongs to the World, but during war time he belongs to his country.”1 Haber defended the use of gas warfare against accusations that it was inhumane, saying that death was death, by whatever means it was inflicted. He stands as an example of the ethical dilemmas that face scientists in times of war and the double-edged nature of the sword of science.
Like Haber, the products made from ammonia can be multifaceted. In addition to their value for agriculture, nitrogen compounds can also be used to achieve destructive ends. Ammonium nitrate has also been used in explosives, including improvised explosive devices. Ammonium nitrate was one of the components of the bomb used in the attack on the Alfred P. Murrah Federal Building in downtown Oklahoma City on April 19, 1995.
It has long been known that nitrogen and hydrogen react to form ammonia. However, it became possible to manufacture ammonia in useful quantities by the reaction of nitrogen and hydrogen only in the early 20th century after the factors that influence its equilibrium were understood.
To be practical, an industrial process must give a large yield of product relatively quickly. One way to increase the yield of ammonia is to increase the pressure on the system in which N2, H2, and NH3 are at equilibrium or are coming to equilibrium.
The formation of additional amounts of ammonia reduces the total pressure exerted by the system and somewhat reduces the stress of the increased pressure.
Although increasing the pressure of a mixture of N2, H2, and NH3 will increase the yield of ammonia, at low temperatures, the rate of formation of ammonia is slow. At room temperature, for example, the reaction is so slow that if we prepared a mixture of N2 and H2, no detectable amount of ammonia would form during our lifetime. The formation of ammonia from hydrogen and nitrogen is an exothermic process:
Thus, increasing the temperature to increase the rate lowers the yield. If we lower the temperature to shift the equilibrium to favor the formation of more ammonia, equilibrium is reached more slowly because of the large decrease of reaction rate with decreasing temperature.
Part of the rate of formation lost by operating at lower temperatures can be recovered by using a catalyst. The net effect of the catalyst on the reaction is to cause equilibrium to be reached more rapidly.
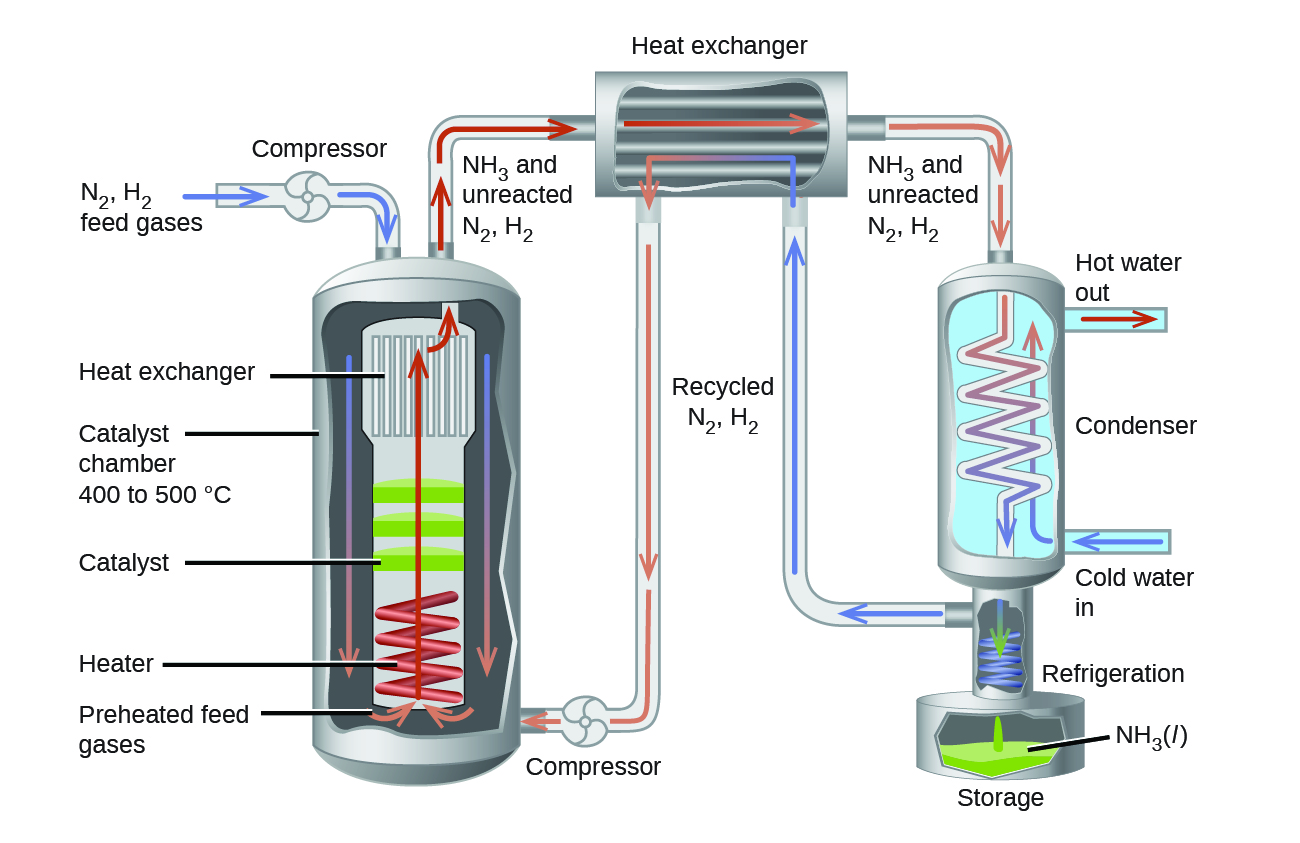
In the commercial production of ammonia, conditions of about 500 °C, 150–900 atm, and the presence of a catalyst are used to give the best compromise among rate, yield, and the cost of the equipment necessary to produce and contain high-pressure gases at high temperatures ((Figure)).
Among the factors affecting chemical reaction rates discussed earlier in this chapter was the presence of a catalyst, a substance that can increase the reaction rate without being consumed in the reaction. The concepts introduced in the previous section on reaction mechanisms provide the basis for understanding how catalysts are able to accomplish this very important function.
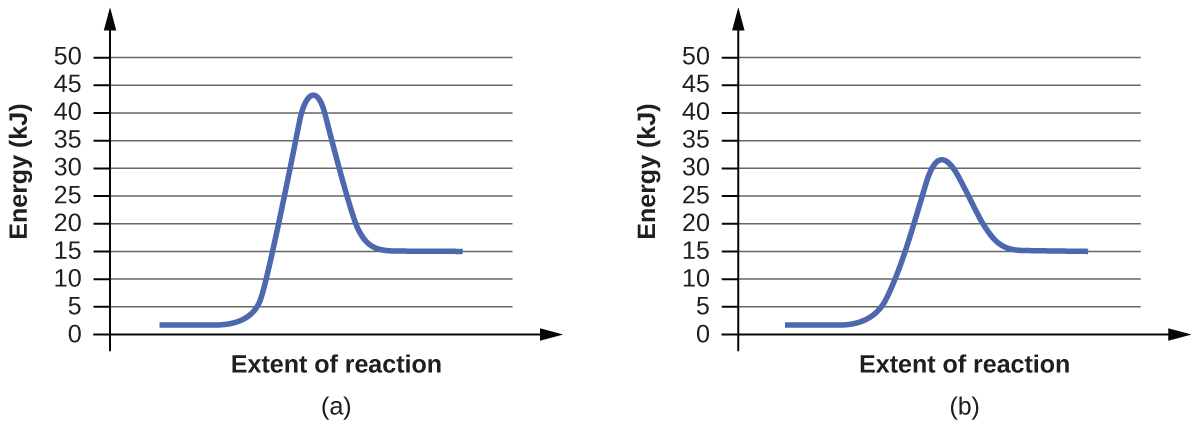
(Figure) shows reaction diagrams for a chemical process in the absence and presence of a catalyst. Inspection of the diagrams reveals several traits of these reactions. Consistent with the fact that the two diagrams represent the same overall reaction, both curves begin and end at the same energies (in this case, because products are more energetic than reactants, the reaction is endothermic). The reaction mechanisms, however, are clearly different. The uncatalyzed reaction proceeds via a one-step mechanism (one transition state observed), whereas the catalyzed reaction follows a two-step mechanism (two transition states observed) with a notably lesser activation energy. This difference illustrates the means by which a catalyst functions to accelerate reactions, namely, by providing an alternative reaction mechanism with a lower activation energy. Although the catalyzed reaction mechanism for a reaction needn’t necessarily involve a different number of steps than the uncatalyzed mechanism, it must provide a reaction path whose rate determining step is faster (lower Ea).
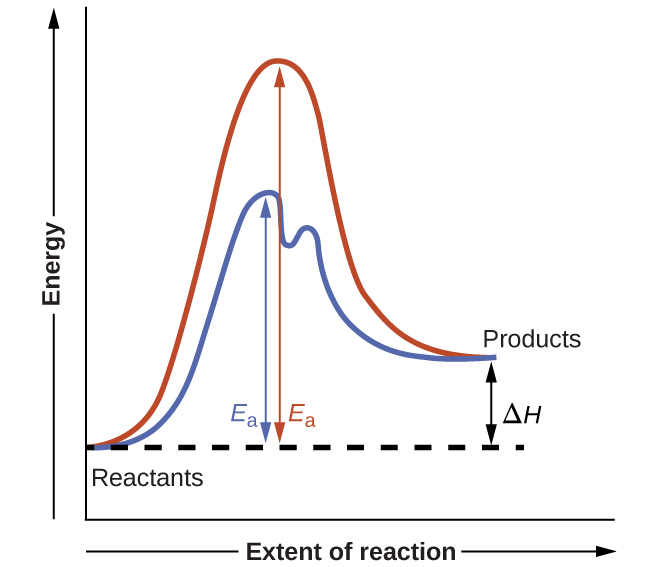
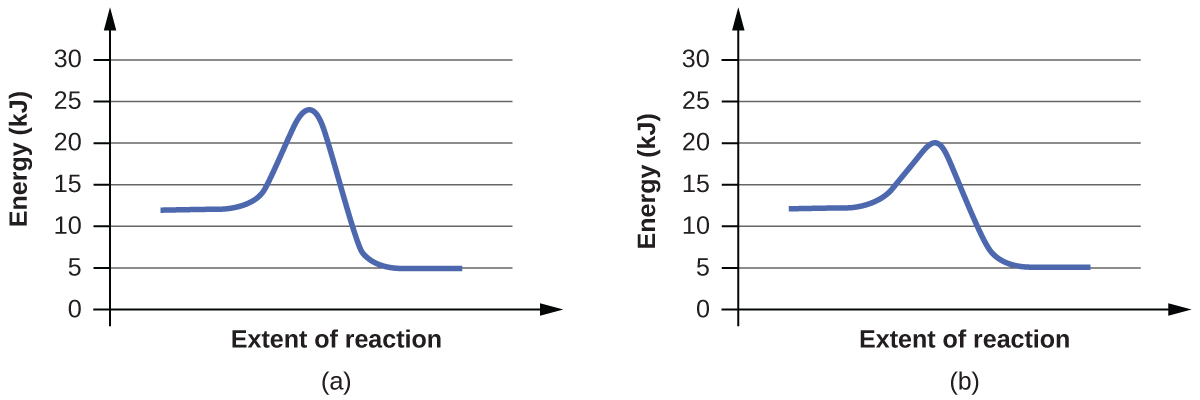
Reaction Diagrams for Catalyzed Reactions The two reaction diagrams here represent the same reaction: one without a catalyst and one with a catalyst. Estimate the activation energy for each process, and identify which one involves a catalyst.
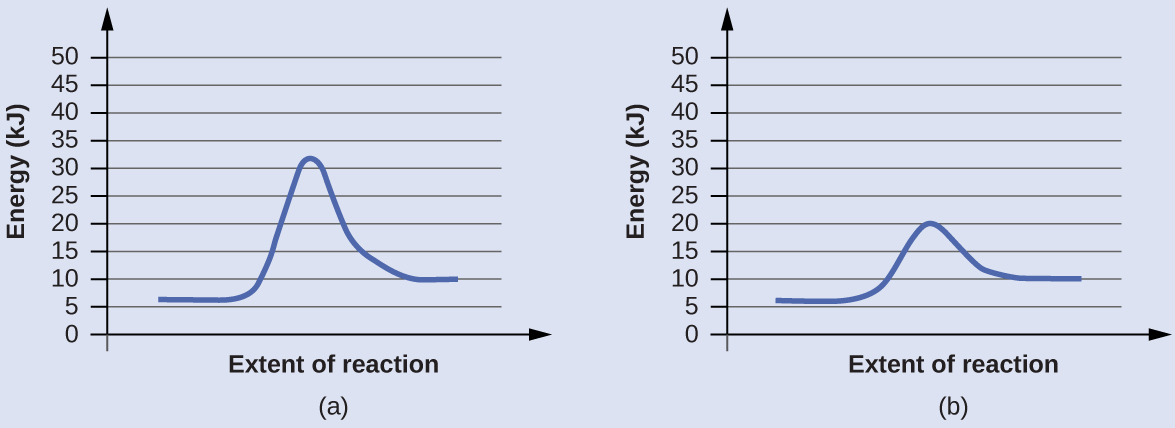
Solution Activation energies are calculated by subtracting the reactant energy from the transition state energy.
The catalyzed reaction is the one with lesser activation energy, in this case represented by diagram (b).
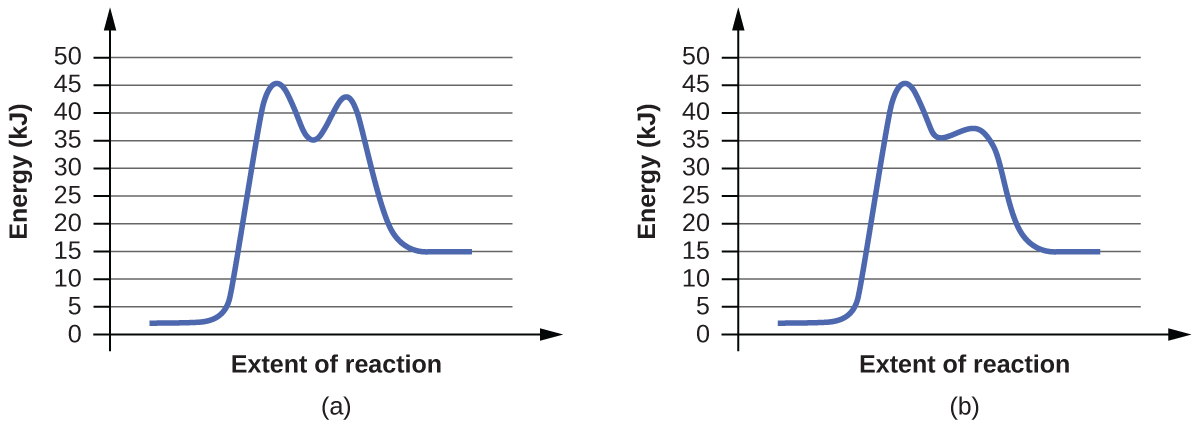
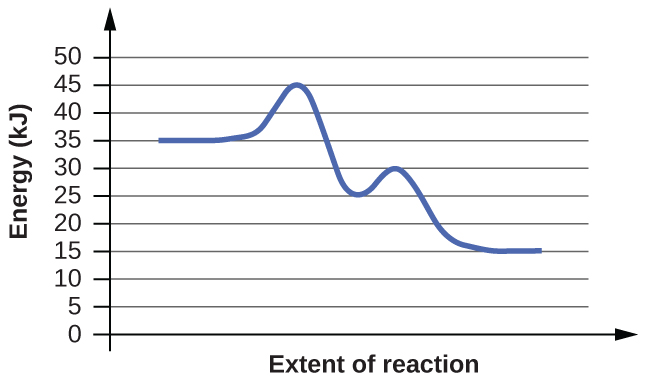
Check Your Learning Reaction diagrams for a chemical process with and without a catalyst are shown below. Both reactions involve a two-step mechanism with a rate-determining first step. Compute activation energies for the first step of each mechanism, and identify which corresponds to the catalyzed reaction. How do the second steps of these two mechanisms compare?
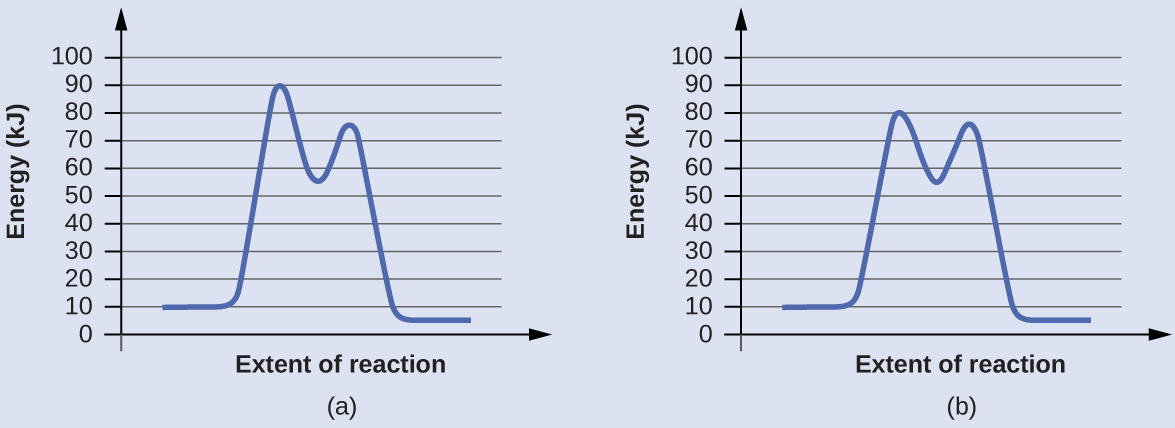
For the first step, Ea = 80 kJ for (a) and 70 kJ for (b), so diagram (b) depicts the catalyzed reaction. Activation energies for the second steps of both mechanisms are the same, 20 kJ.
Homogeneous Catalysts
A homogeneous catalyst is present in the same phase as the reactants. It interacts with a reactant to form an intermediate substance, which then decomposes or reacts with another reactant in one or more steps to regenerate the original catalyst and form product.
As an important illustration of homogeneous catalysis, consider the earth’s ozone layer. Ozone in the upper atmosphere, which protects the earth from ultraviolet radiation, is formed when oxygen molecules absorb ultraviolet light and undergo the reaction:
Ozone is a relatively unstable molecule that decomposes to yield diatomic oxygen by the reverse of this equation. This decomposition reaction is consistent with the following two-step mechanism:
A number of substances can catalyze the decomposition of ozone. For example, the nitric oxide -catalyzed decomposition of ozone is believed to occur via the following three-step mechanism:
As required, the overall reaction is the same for both the two-step uncatalyzed mechanism and the three-step NO-catalyzed mechanism:
Notice that NO is a reactant in the first step of the mechanism and a product in the last step. This is another characteristic trait of a catalyst: Though it participates in the chemical reaction, it is not consumed by the reaction.
The 1995 Nobel Prize in Chemistry was shared by Paul J. Crutzen, Mario J. Molina ((Figure)), and F. Sherwood Rowland “for their work in atmospheric chemistry, particularly concerning the formation and decomposition of ozone.”2 Molina, a Mexican citizen, carried out the majority of his work at the Massachusetts Institute of Technology (MIT).
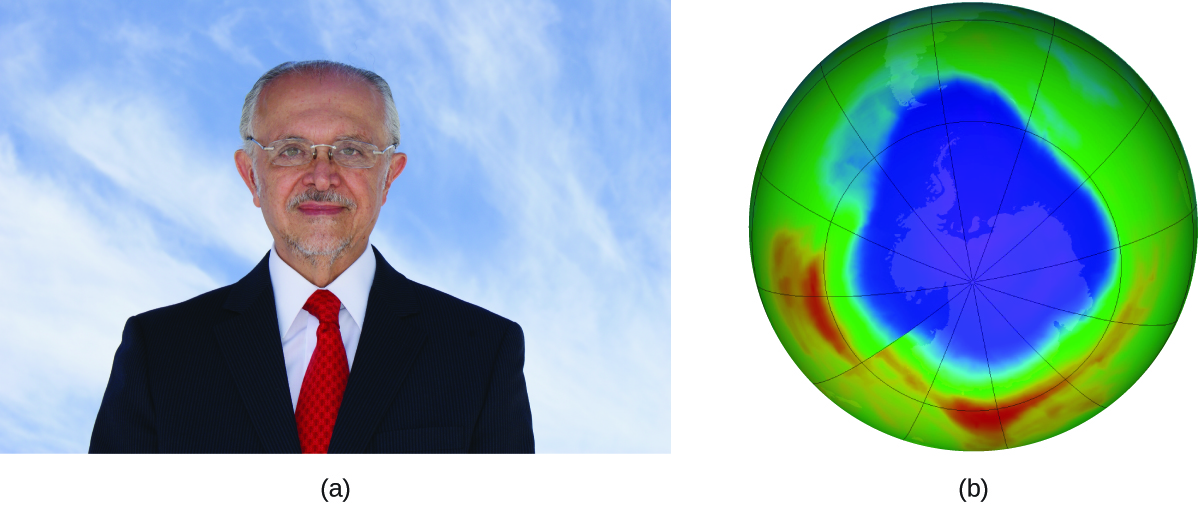
In 1974, Molina and Rowland published a paper in the journal Nature detailing the threat of chlorofluorocarbon gases to the stability of the ozone layer in earth’s upper atmosphere. The ozone layer protects earth from solar radiation by absorbing ultraviolet light. As chemical reactions deplete the amount of ozone in the upper atmosphere, a measurable “hole” forms above Antarctica, and an increase in the amount of solar ultraviolet radiation— strongly linked to the prevalence of skin cancers—reaches earth’s surface. The work of Molina and Rowland was instrumental in the adoption of the Montreal Protocol, an international treaty signed in 1987 that successfully began phasing out production of chemicals linked to ozone destruction.
Molina and Rowland demonstrated that chlorine atoms from human-made chemicals can catalyze ozone destruction in a process similar to that by which NO accelerates the depletion of ozone. Chlorine atoms are generated when chlorocarbons or chlorofluorocarbons—once widely used as refrigerants and propellants—are photochemically decomposed by ultraviolet light or react with hydroxyl radicals. A sample mechanism is shown here using methyl chloride:
Chlorine radicals break down ozone and are regenerated by the following catalytic cycle:
A single monatomic chlorine can break down thousands of ozone molecules. Luckily, the majority of atmospheric chlorine exists as the catalytically inactive forms Cl2 and ClONO2.
Since receiving his portion of the Nobel Prize, Molina has continued his work in atmospheric chemistry at MIT.
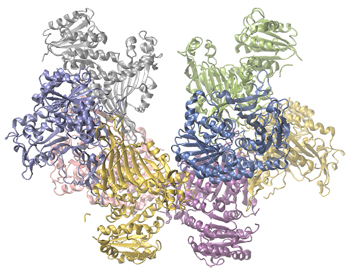
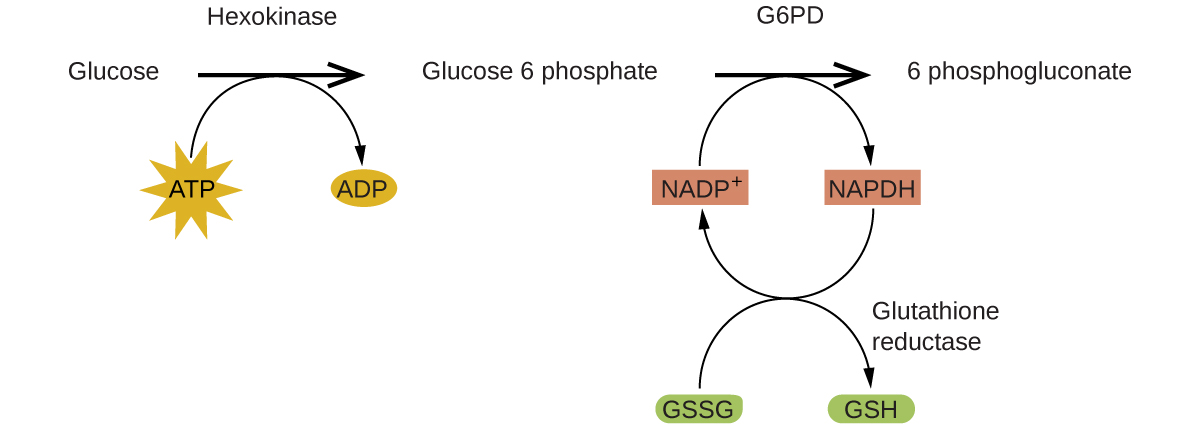
Enzymes in the human body act as catalysts for important chemical reactions in cellular metabolism. As such, a deficiency of a particular enzyme can translate to a life-threatening disease. G6PD (glucose-6-phosphate dehydrogenase) deficiency, a genetic condition that results in a shortage of the enzyme glucose-6-phosphate dehydrogenase, is the most common enzyme deficiency in humans. This enzyme, shown in (Figure), is the rate-limiting enzyme for the metabolic pathway that supplies NADPH to cells ((Figure)).
A disruption in this pathway can lead to reduced glutathione in red blood cells; once all glutathione is consumed, enzymes and other proteins such as hemoglobin are susceptible to damage. For example, hemoglobin can be metabolized to bilirubin, which leads to jaundice, a condition that can become severe. People who suffer from G6PD deficiency must avoid certain foods and medicines containing chemicals that can trigger damage their glutathione-deficient red blood cells.
Heterogeneous Catalysts
A heterogeneous catalyst is a catalyst that is present in a different phase (usually a solid) than the reactants. Such catalysts generally function by furnishing an active surface upon which a reaction can occur. Gas and liquid phase reactions catalyzed by heterogeneous catalysts occur on the surface of the catalyst rather than within the gas or liquid phase.
Heterogeneous catalysis typically involves the following processes:
- Adsorption of the reactant(s) onto the surface of the catalyst
- Activation of the adsorbed reactant(s)
- Reaction of the adsorbed reactant(s)
- Desorption of product(s) from the surface of the catalyst
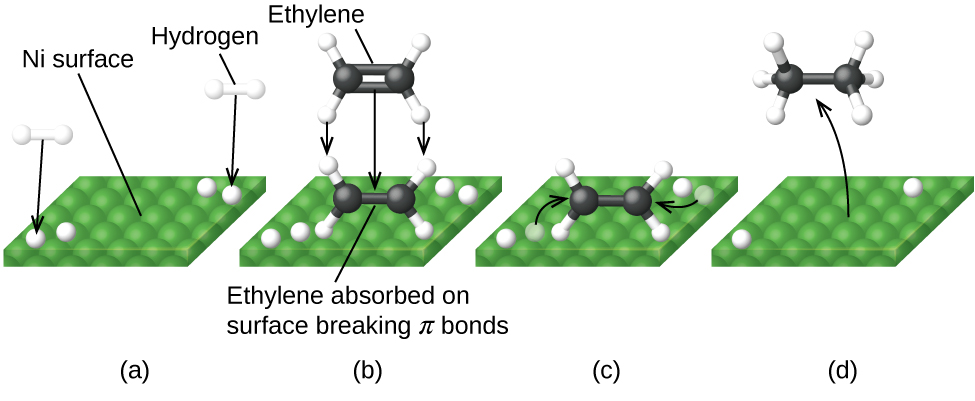
(Figure) illustrates the steps of a mechanism for the reaction of compounds containing a carbon–carbon double bond with hydrogen on a nickel catalyst. Nickel is the catalyst used in the hydrogenation of polyunsaturated fats and oils (which contain several carbon–carbon double bonds) to produce saturated fats and oils (which contain only carbon–carbon single bonds).
Many important chemical products are prepared via industrial processes that use heterogeneous catalysts, including ammonia, nitric acid, sulfuric acid, and methanol. Heterogeneous catalysts are also used in the catalytic converters found on most gasoline-powered automobiles ((Figure)).
Scientists developed catalytic converters to reduce the amount of toxic emissions produced by burning gasoline in internal combustion engines. By utilizing a carefully selected blend of catalytically active metals, it is possible to effect complete combustion of all carbon-containing compounds to carbon dioxide while also reducing the output of nitrogen oxides. This is particularly impressive when we consider that one step involves adding more oxygen to the molecule and the other involves removing the oxygen ((Figure)).
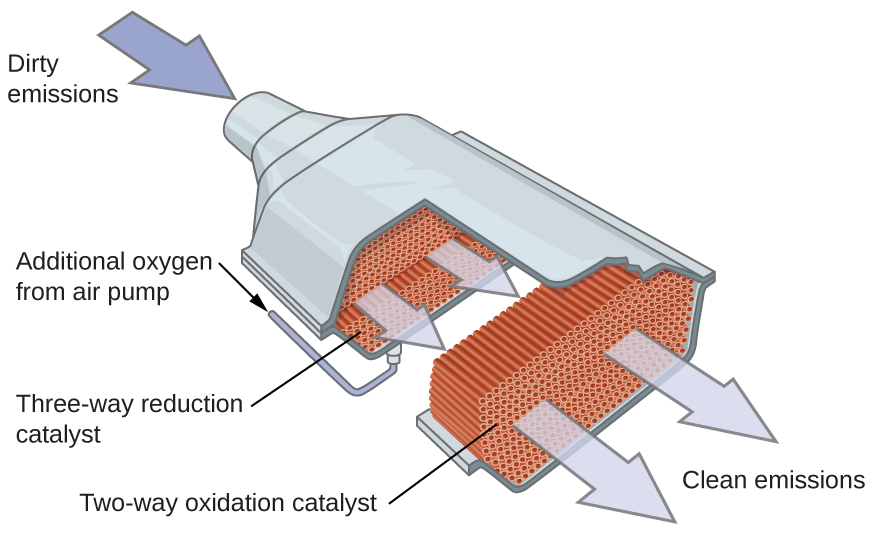
Most modern, three-way catalytic converters possess a surface impregnated with a platinum-rhodium catalyst, which catalyzes the conversion of nitric oxide into dinitrogen and oxygen as well as the conversion of carbon monoxide and hydrocarbons such as octane into carbon dioxide and water vapor:
In order to be as efficient as possible, most catalytic converters are preheated by an electric heater. This ensures that the metals in the catalyst are fully active even before the automobile exhaust is hot enough to maintain appropriate reaction temperatures.
The University of California at Davis’ “ChemWiki” provides a thorough explanation of how catalytic converters work.
The study of enzymes is an important interconnection between biology and chemistry. Enzymes are usually proteins (polypeptides) that help to control the rate of chemical reactions between biologically important compounds, particularly those that are involved in cellular metabolism. Different classes of enzymes perform a variety of functions, as shown in (Figure).
| Classes of Enzymes and Their Functions | |
|---|---|
| Class | Function |
| oxidoreductases | redox reactions |
| transferases | transfer of functional groups |
| hydrolases | hydrolysis reactions |
| lyases | group elimination to form double bonds |
| isomerases | isomerization |
| ligases | bond formation with ATP hydrolysis |
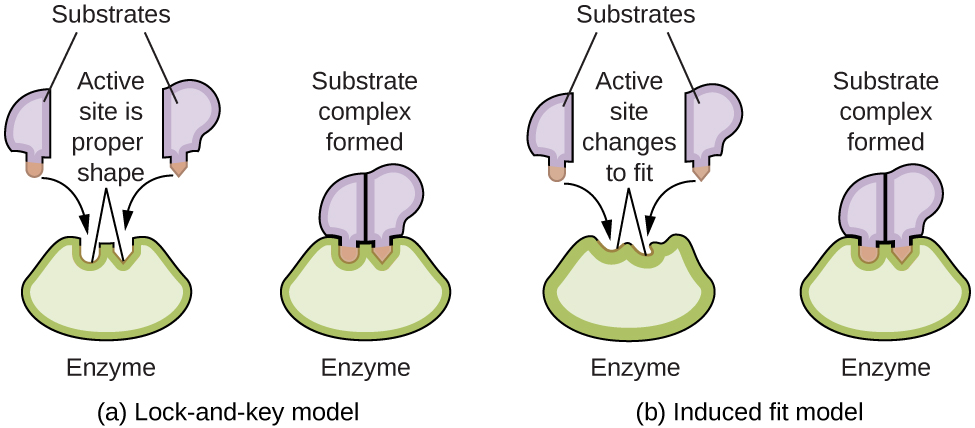
Enzyme molecules possess an active site, a part of the molecule with a shape that allows it to bond to a specific substrate (a reactant molecule), forming an enzyme-substrate complex as a reaction intermediate. There are two models that attempt to explain how this active site works. The most simplistic model is referred to as the lock-and-key hypothesis, which suggests that the molecular shapes of the active site and substrate are complementary, fitting together like a key in a lock. The induced fit hypothesis, on the other hand, suggests that the enzyme molecule is flexible and changes shape to accommodate a bond with the substrate. This is not to suggest that an enzyme’s active site is completely malleable, however. Both the lock-and-key model and the induced fit model account for the fact that enzymes can only bind with specific substrates, since in general a particular enzyme only catalyzes a particular reaction ((Figure)).
The Royal Society of Chemistry provides an excellent introduction to enzymes for students and teachers.
The connection between the rate of a reaction and its equilibrium constant is one we can easily determine with just a bit of algebraic substitution. For a reaction where substance A forms B (and the reverse)
The rate of the forward reaction is
And the rate of the reverse reaction is
Once equilibrium is established, the rates of the forward and reverse reactions are equal:
Rearranging a bit, we get
Also recall that the equilibrium constant is simply the ratio of product to reactant concentration at equilibrium:
So the equilibrium constant turns out to be the ratio of the forward to the reverse rate constants. This relationship also helps cement our understanding of the nature of a catalyst. That is, a catalyst does not change the fundamental equilibrium (or the underlying thermodynamics) of a reaction. Rather, what it does is alter the rate constant for the reaction – that is, both rate constants, forward and reverse, equally. In doing so, catalysts usually speed up the rate at which reactions attain equilibrium (though they can be used to slow down the rate of reaction as well!).
Key Concepts and Summary
Catalysts affect the rate of a chemical reaction by altering its mechanism to provide a lower activation energy, but they do not affect equilibrium. Catalysts can be homogenous (in the same phase as the reactants) or heterogeneous (a different phase than the reactants).
Chemistry End of Chapter Exercises
Account for the increase in reaction rate brought about by a catalyst.
The general mode of action for a catalyst is to provide a mechanism by which the reactants can unite more readily by taking a path with a lower reaction energy. The rates of both the forward and the reverse reactions are increased, leading to a faster achievement of equilibrium.
Compare the functions of homogeneous and heterogeneous catalysts.
Consider this scenario and answer the following questions: Chlorine atoms resulting from decomposition of chlorofluoromethanes, such as CCl2F2, catalyze the decomposition of ozone in the atmosphere. One simplified mechanism for the decomposition is:
\(\begin{array}{}\\ \\ {\text{O}}_{3}\stackrel{\phantom{\rule{0.2em}{0ex}}\text{sunlight}\phantom{\rule{0.2em}{0ex}}}{\to }{\text{O}}_{2}+\text{O}\\ {\text{O}}_{3}+\text{Cl}\phantom{\rule{0.2em}{0ex}}⟶\phantom{\rule{0.2em}{0ex}}{\text{O}}_{2}+\text{ClO}\\ \text{ClO}+\text{O}\phantom{\rule{0.2em}{0ex}}⟶\phantom{\rule{0.2em}{0ex}}\text{Cl}+{\text{O}}_{2}\end{array}\)
(a) Explain why chlorine atoms are catalysts in the gas-phase transformation:
\(2{\text{O}}_{3}\phantom{\rule{0.2em}{0ex}}⟶\phantom{\rule{0.2em}{0ex}}3{\text{O}}_{2}\)
(b) Nitric oxide is also involved in the decomposition of ozone by the mechanism:
\(\begin{array}{}\\ {\text{O}}_{3}\stackrel{\phantom{\rule{0.2em}{0ex}}\text{sunlight}\phantom{\rule{0.2em}{0ex}}}{\to }{\text{O}}_{2}+\text{O}\\ {\text{O}}_{3}+\text{NO}\phantom{\rule{0.2em}{0ex}}⟶\phantom{\rule{0.2em}{0ex}}{\text{NO}}_{2}+{\text{O}}_{2}\\ {\text{NO}}_{2}+\text{O}\phantom{\rule{0.2em}{0ex}}⟶\phantom{\rule{0.2em}{0ex}}\text{NO}+{\text{O}}_{2}\end{array}\)
Is NO a catalyst for the decomposition? Explain your answer.
(a) Chlorine atoms are a catalyst because they react in the second step but are regenerated in the third step. Thus, they are not used up, which is a characteristic of catalysts. (b) NO is a catalyst for the same reason as in part (a).
Water gas is a 1:1 mixture of carbon monoxide and hydrogen gas and is called water gas because it is formed from steam and hot carbon in the following reaction: \({\text{H}}_{2}\text{O}\left(g\right)+\text{C}\left(s\right)⇌{\text{H}}_{2}\left(g\right)+\text{CO}\left(g\right).\) Methanol, a liquid fuel that could possibly replace gasoline, can be prepared from water gas and hydrogen at high temperature and pressure in the presence of a suitable catalyst. What will happen to the concentrations of H2, CO, and CH3OH at equilibrium if more catalyst is added?
no changes.
Nitrogen and oxygen react at high temperatures. What will happen to the concentrations of N2, O2, and NO at equilibrium if a catalyst is added?
For each of the following pairs of reaction diagrams, identify which of the pair is catalyzed:
(a)
(b)
For each of the following pairs of reaction diagrams, identify which of the pairs is catalyzed:
(a)
(b)
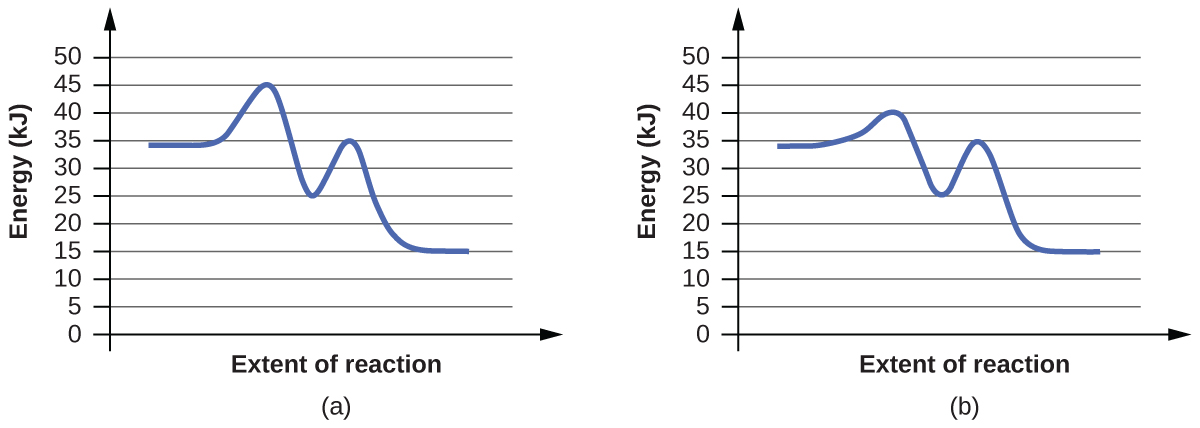
The lowering of the transition state energy indicates the effect of a catalyst. (a) B; (b) B
For each of the following reaction diagrams, estimate the activation energy (Ea) of the reaction:
(a)
(b)
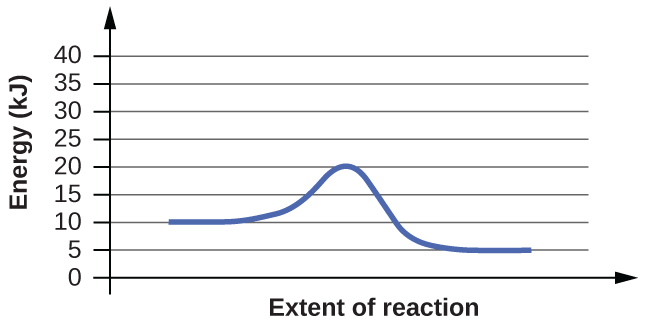
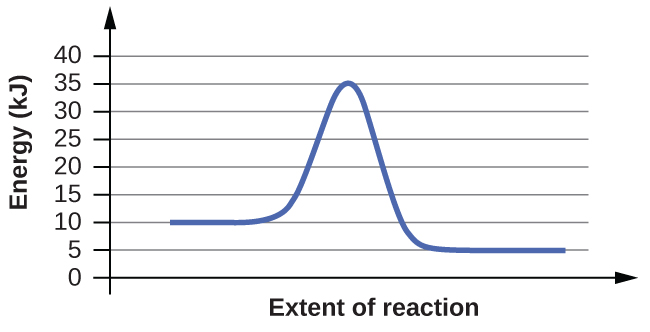
For each of the following reaction diagrams, estimate the activation energy (Ea) of the reaction:
(a)
(b)
The energy needed to go from the initial state to the transition state is (a) 10 kJ; (b) 10 kJ
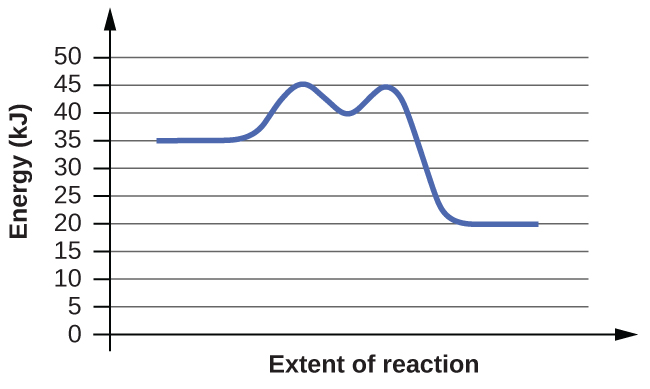
Assuming the diagrams in (Figure) represent different mechanisms for the same reaction, which of the reactions has the faster rate?
Consider the similarities and differences in the two reaction diagrams shown in (Figure). Do these diagrams represent two different overall reactions, or do they represent the same overall reaction taking place by two different mechanisms? Explain your answer.
Both diagrams describe two-step, exothermic reactions, but with different changes in enthalpy, suggesting the diagrams depict two different overall reactions.
Footnotes
- 1Herrlich, P. “The Responsibility of the Scientist: What Can History Teach Us About How Scientists Should Handle Research That Has the Potential to Create Harm?” EMBO Reports 14 (2013): 759–764.
- 2“The Nobel Prize in Chemistry 1995,” Nobel Prize.org, accessed February 18, 2015, http://www.nobelprize.org/nobel_prizes/chemistry/laureates/1995/.
Glossary
- heterogeneous catalyst
- catalyst present in a different phase from the reactants, furnishing a surface at which a reaction can occur
- homogeneous catalyst
- catalyst present in the same phase as the reactants
