
105 Collision Theory
[latexpage]
Learning Objectives
By the end of this section, you will be able to:
- Use the postulates of collision theory to explain the effects of physical state, temperature, and concentration on reaction rates
- Define the concepts of activation energy and transition state
- Use the Arrhenius equation in calculations relating rate constants to temperature
We should not be surprised that atoms, molecules, or ions must collide before they can react with each other. Atoms must be close together to form chemical bonds. This simple premise is the basis for a very powerful theory that explains many observations regarding chemical kinetics, including factors affecting reaction rates.
Collision theory is based on the following postulates:
-
The rate of a reaction is proportional to the rate of reactant collisions:
\(\text{reaction rate}\phantom{\rule{0.2em}{0ex}}\propto \phantom{\rule{0.2em}{0ex}}\frac{#\phantom{\rule{0.2em}{0ex}}\text{collisions}}{\text{time}}\) -
The reacting species must collide in an orientation that allows contact between the atoms that will become bonded together in the product.
-
The collision must occur with adequate energy to permit mutual penetration of the reacting species’ valence shells so that the electrons can rearrange and form new bonds (and new chemical species).
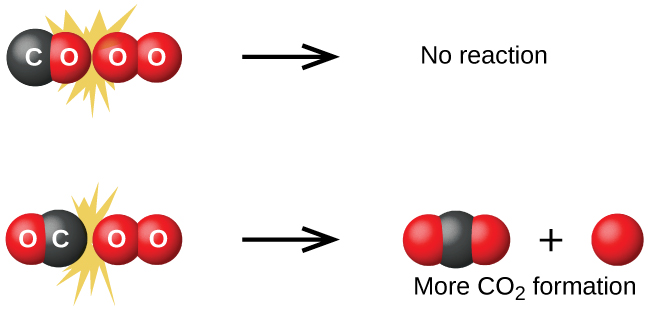
We can see the importance of the two physical factors noted in postulates 2 and 3, the orientation and energy of collisions, when we consider the reaction of carbon monoxide with oxygen:
Carbon monoxide is a pollutant produced by the combustion of hydrocarbon fuels. To reduce this pollutant, automobiles have catalytic converters that use a catalyst to carry out this reaction. It is also a side reaction of the combustion of gunpowder that results in muzzle flash for many firearms. If carbon monoxide and oxygen are present in sufficient amounts, the reaction will occur at high temperature and pressure.
The first step in the gas-phase reaction between carbon monoxide and oxygen is a collision between the two molecules:
Although there are many different possible orientations the two molecules can have relative to each other, consider the two presented in (Figure). In the first case, the oxygen side of the carbon monoxide molecule collides with the oxygen molecule. In the second case, the carbon side of the carbon monoxide molecule collides with the oxygen molecule. The second case is clearly more likely to result in the formation of carbon dioxide, which has a central carbon atom bonded to two oxygen atoms \(\left(\text{O}=\text{C}=\text{O}\right).\) This is a rather simple example of how important the orientation of the collision is in terms of creating the desired product of the reaction.
If the collision does take place with the correct orientation, there is still no guarantee that the reaction will proceed to form carbon dioxide. In addition to a proper orientation, the collision must also occur with sufficient energy to result in product formation. When reactant species collide with both proper orientation and adequate energy, they combine to form an unstable species called an activated complex or a transition state. These species are very short lived and usually undetectable by most analytical instruments. In some cases, sophisticated spectral measurements have been used to observe transition states.
Collision theory explains why most reaction rates increase as concentrations increase. With an increase in the concentration of any reacting substance, the chances for collisions between molecules are increased because there are more molecules per unit of volume. More collisions mean a faster reaction rate, assuming the energy of the collisions is adequate.
Activation Energy and the Arrhenius Equation
The minimum energy necessary to form a product during a collision between reactants is called the activation energy (Ea). How this energy compares to the kinetic energy provided by colliding reactant molecules is a primary factor affecting the rate of a chemical reaction. If the activation energy is much larger than the average kinetic energy of the molecules, the reaction will occur slowly since only a few fast-moving molecules will have enough energy to react. If the activation energy is much smaller than the average kinetic energy of the molecules, a large fraction of molecules will be adequately energetic and the reaction will proceed rapidly.
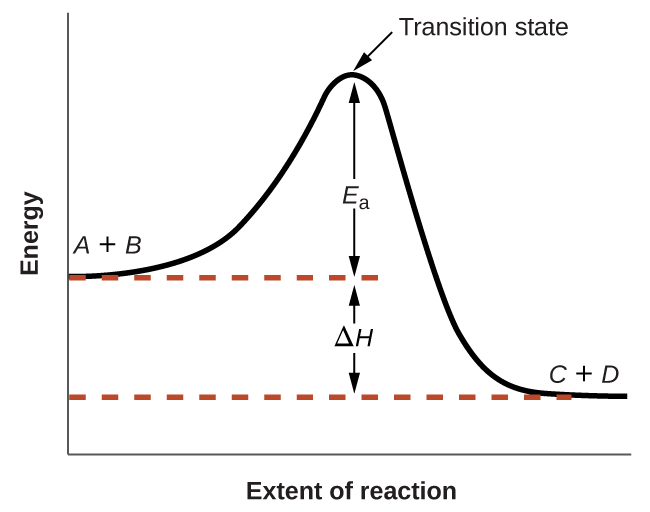
(Figure) shows how the energy of a chemical system changes as it undergoes a reaction converting reactants to products according to the equation
These reaction diagrams are widely used in chemical kinetics to illustrate various properties of the reaction of interest. Viewing the diagram from left to right, the system initially comprises reactants only, A + B. Reactant molecules with sufficient energy can collide to form a high-energy activated complex or transition state. The unstable transition state can then subsequently decay to yield stable products, C + D. The diagram depicts the reaction’s activation energy, Ea, as the energy difference between the reactants and the transition state. Using a specific energy, the enthalpy (see chapter on thermochemistry), the enthalpy change of the reaction, ΔH, is estimated as the energy difference between the reactants and products. In this case, the reaction is exothermic (ΔH < 0) since it yields a decrease in system enthalpy.
The Arrhenius equation relates the activation energy and the rate constant, k, for many chemical reactions:
In this equation, R is the ideal gas constant, which has a value 8.314 J/mol/K, T is temperature on the Kelvin scale, Ea is the activation energy in joules per mole, e is the constant 2.7183, and A is a constant called the frequency factor, which is related to the frequency of collisions and the orientation of the reacting molecules.
Postulates of collision theory are nicely accommodated by the Arrhenius equation. The frequency factor, A, reflects how well the reaction conditions favor properly oriented collisions between reactant molecules. An increased probability of effectively oriented collisions results in larger values for A and faster reaction rates.
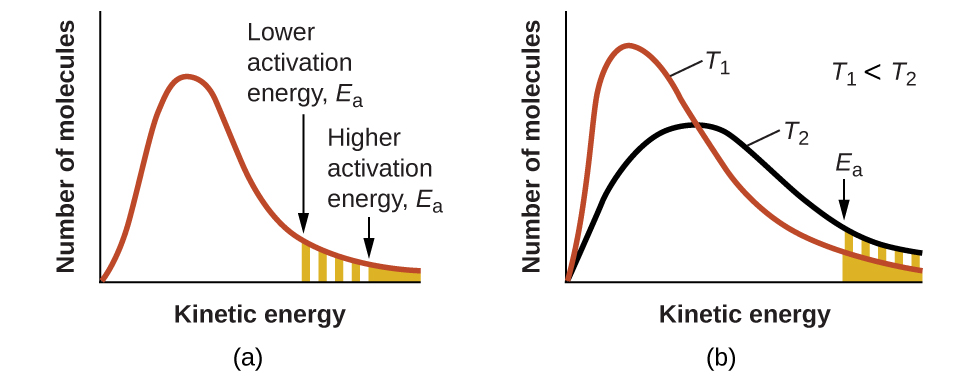
The exponential term, e−Ea/RT, describes the effect of activation energy on reaction rate. According to kinetic molecular theory (see chapter on gases), the temperature of matter is a measure of the average kinetic energy of its constituent atoms or molecules. The distribution of energies among the molecules composing a sample of matter at any given temperature is described by the plot shown in (Figure)(a). Two shaded areas under the curve represent the numbers of molecules possessing adequate energy (RT) to overcome the activation barriers (Ea). A lower activation energy results in a greater fraction of adequately energized molecules and a faster reaction.
The exponential term also describes the effect of temperature on reaction rate. A higher temperature represents a correspondingly greater fraction of molecules possessing sufficient energy (RT) to overcome the activation barrier (Ea), as shown in (Figure)(b). This yields a greater value for the rate constant and a correspondingly faster reaction rate.
A convenient approach for determining Ea for a reaction involves the measurement of k at two or more different temperatures and using an alternate version of the Arrhenius equation that takes the form of a linear equation
A plot of ln k versus \(\frac{1}{T}\) is linear with a slope equal to \(\frac{\text{−}{E}_{\text{a}}}{R}\) and a y-intercept equal to ln A.
Determination of Ea The variation of the rate constant with temperature for the decomposition of HI(g) to H2(g) and I2(g) is given here. What is the activation energy for the reaction?
| T (K) | k (L/mol/s) |
|---|---|
| 555 | 3.52 \(×\) 10−7 |
| 575 | 1.22 \(×\) 10−6 |
| 645 | 8.59 \(×\) 10−5 |
| 700 | 1.16 \(×\) 10−3 |
| 781 | 3.95 \(×\) 10−2 |
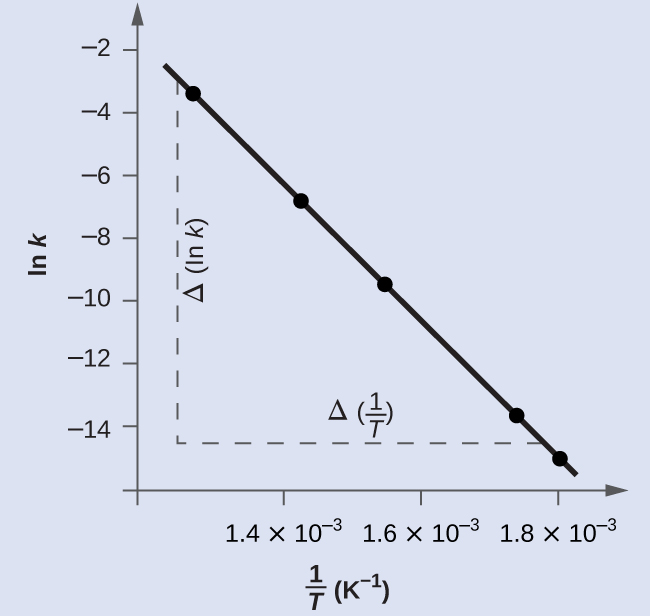
Solution Use the provided data to derive values of \(\frac{1}{T}\) and ln k:
| \(\frac{1}{\text{T}}\phantom{\rule{0.4em}{0ex}}\left({\text{K}}^{-1}\right)\) | ln k |
|---|---|
| 1.80 \(×\) 10−3 | −14.860 |
| 1.74 \(×\) 10−3 | −13.617 |
| 1.55 \(×\) 10−3 | −9.362 |
| 1.43 \(×\) 10−3 | −6.759 |
| 1.28 \(×\) 10−3 | −3.231 |
(Figure) is a graph of ln k versus \(\frac{1}{T}.\) In practice, the equation of the line (slope and y-intercept) that best fits these plotted data points would be derived using a statistical process called regression. This is helpful for most experimental data because a perfect fit of each data point with the line is rarely encountered. For the data here, the fit is nearly perfect and the slope may be estimated using any two of the provided data pairs. Using the first and last data points permits estimation of the slope.
Alternative approach: A more expedient approach involves deriving activation energy from measurements of the rate constant at just two temperatures. In this approach, the Arrhenius equation is rearranged to a convenient two-point form:
Rearranging this equation to isolate activation energy yields:
Any two data pairs may be substituted into this equation—for example, the first and last entries from the above data table:
and the result is Ea<!– no-selfclose –> = 1.8 \(×\) 105 J mol−1 or 180 kJ mol−1
This approach yields the same result as the more rigorous graphical approach used above, as expected. In practice, the graphical approach typically provides more reliable results when working with actual experimental data.
Check Your Learning The rate constant for the rate of decomposition of N2O5 to NO and O2 in the gas phase is 1.66 L/mol/s at 650 K and 7.39 L/mol/s at 700 K:
Assuming the kinetics of this reaction are consistent with the Arrhenius equation, calculate the activation energy for this decomposition.
1.1 \(×\) 105 J mol−1 or 110 kJ mol−1
Key Concepts and Summary
Chemical reactions typically require collisions between reactant species. These reactant collisions must be of proper orientation and sufficient energy in order to result in product formation. Collision theory provides a simple but effective explanation for the effect of many experimental parameters on reaction rates. The Arrhenius equation describes the relation between a reaction’s rate constant, activation energy, temperature, and dependence on collision orientation.
Key Equations
- \(k=A{e}^{\text{−}{E}_{\text{a}}\text{/}RT}\)
- \(\text{ln}\phantom{\rule{0.2em}{0ex}}k=\left(\frac{\text{−}{E}_{\text{a}}}{R}\right)\phantom{\rule{0.2em}{0ex}}\left(\frac{1}{T}\right)+\text{ln}\phantom{\rule{0.2em}{0ex}}A\)
- \(\text{ln}\phantom{\rule{0.2em}{0ex}}\frac{{k}_{1}}{{k}_{2}}\phantom{\rule{0.1em}{0ex}}=\phantom{\rule{0.1em}{0ex}}\frac{{E}_{\text{a}}}{R}\phantom{\rule{0.2em}{0ex}}\left(\frac{1}{{T}_{2}}\phantom{\rule{0.2em}{0ex}}-\phantom{\rule{0.2em}{0ex}}\frac{1}{{T}_{1}}\right)\)
Chemistry End of Chapter Exercises
Chemical reactions occur when reactants collide. What are two factors that may prevent a collision from producing a chemical reaction?
The reactants either may be moving too slowly to have enough kinetic energy to exceed the activation energy for the reaction, or the orientation of the molecules when they collide may prevent the reaction from occurring.
When every collision between reactants leads to a reaction, what determines the rate at which the reaction occurs?
What is the activation energy of a reaction, and how is this energy related to the activated complex of the reaction?
The activation energy is the minimum amount of energy necessary to form the activated complex in a reaction. It is usually expressed as the energy necessary to form one mole of activated complex.
Account for the relationship between the rate of a reaction and its activation energy.
Describe how graphical methods can be used to determine the activation energy of a reaction from a series of data that includes the rate of reaction at varying temperatures.
After finding k at several different temperatures, a plot of ln k versus \(\frac{1}{T},\) gives a straight line with the slope \(\frac{\text{−}{E}_{\text{a}}}{R}\) from which Ea may be determined.
How does an increase in temperature affect rate of reaction? Explain this effect in terms of the collision theory of the reaction rate.
The rate of a certain reaction doubles for every 10 °C rise in temperature.
(a) How much faster does the reaction proceed at 45 °C than at 25 °C?
(b) How much faster does the reaction proceed at 95 °C than at 25 °C?
(a) 4-times faster (b) 128-times faster
In an experiment, a sample of NaClO3 was 90% decomposed in 48 min. Approximately how long would this decomposition have taken if the sample had been heated 20 °C higher? (Hint: Assume the rate doubles for each 10 °C rise in temperature.)
The rate constant at 325 °C for the decomposition reaction \({\text{C}}_{4}{\text{H}}_{8}\phantom{\rule{0.2em}{0ex}}⟶\phantom{\rule{0.2em}{0ex}}{2\text{C}}_{2}{\text{H}}_{4}\) is 6.1 \(×\) 10−8 s−1, and the activation energy is 261 kJ per mole of C4H8. Determine the frequency factor for the reaction.
\(3.9\phantom{\rule{0.2em}{0ex}}×\phantom{\rule{0.2em}{0ex}}{10}^{15}\phantom{\rule{0.2em}{0ex}}{\text{s}}^{-1}\)
The rate constant for the decomposition of acetaldehyde, CH3CHO, to methane, CH4, and carbon monoxide, CO, in the gas phase is 1.1 \(×\) 10−2 L mol−1 s−1 at 703 K and 4.95 L mol−1 s−1 at 865 K. Determine the activation energy for this decomposition.
An elevated level of the enzyme alkaline phosphatase (ALP) in human serum is an indication of possible liver or bone disorder. The level of serum ALP is so low that it is very difficult to measure directly. However, ALP catalyzes a number of reactions, and its relative concentration can be determined by measuring the rate of one of these reactions under controlled conditions. One such reaction is the conversion of p-nitrophenyl phosphate (PNPP) to p-nitrophenoxide ion (PNP) and phosphate ion. Control of temperature during the test is very important; the rate of the reaction increases 1.47 times if the temperature changes from 30 °C to 37 °C. What is the activation energy for the ALP–catalyzed conversion of PNPP to PNP and phosphate?
43.0 kJ/mol
In terms of collision theory, to which of the following is the rate of a chemical reaction proportional?
(a) the change in free energy per second
(b) the change in temperature per second
(c) the number of collisions per second
(d) the number of product molecules
Hydrogen iodide, HI, decomposes in the gas phase to produce hydrogen, H2, and iodine, I2. The value of the rate constant, k, for the reaction was measured at several different temperatures and the data are shown here:
| Temperature (K) | k (L mol−1 s−1) |
|---|---|
| 555 | 6.23 \(×\) 10−7 |
| 575 | 2.42 \(×\) 10−6 |
| 645 | 1.44 \(×\) 10−4 |
| 700 | 2.01 \(×\) 10−3 |
What is the value of the activation energy (in kJ/mol) for this reaction?
177 kJ/mol
The element Co exists in two oxidation states, Co(II) and Co(III), and the ions form many complexes. The rate at which one of the complexes of Co(III) was reduced by Fe(II) in water was measured. Determine the activation energy of the reaction from the following data:
| T (K) | k (s−1) |
|---|---|
| 293 | 0.054 |
| 298 | 0.100 |
The hydrolysis of the sugar sucrose to the sugars glucose and fructose,
\({\text{C}}_{12}{\text{H}}_{22}{\text{O}}_{11}+{\text{H}}_{2}\text{O}\phantom{\rule{0.2em}{0ex}}⟶\phantom{\rule{0.2em}{0ex}}{\text{C}}_{6}{\text{H}}_{12}{\text{O}}_{6}+{\text{C}}_{6}{\text{H}}_{12}{\text{O}}_{6}\)
follows a first-order rate law for the disappearance of sucrose: rate = k[C12H22O11] (The products of the reaction, glucose and fructose, have the same molecular formulas but differ in the arrangement of the atoms in their molecules.)
(a) In neutral solution, k = 2.1 \(×\) 10−11 s−1 at 27 °C and 8.5 \(×\) 10−11 s−1 at 37 °C. Determine the activation energy, the frequency factor, and the rate constant for this equation at 47 °C (assuming the kinetics remain consistent with the Arrhenius equation at this temperature).
(b) When a solution of sucrose with an initial concentration of 0.150 M reaches equilibrium, the concentration of sucrose is 1.65 \(×\) 10−7M. How long will it take the solution to reach equilibrium at 27 °C in the absence of a catalyst? Because the concentration of sucrose at equilibrium is so low, assume that the reaction is irreversible.
(c) Why does assuming that the reaction is irreversible simplify the calculation in part (b)?
Ea = 108 kJ; A = 2.0 \(×\) 108 s−1; k = 3.2 \(×\) 10−10 s−1; (b) 1.81 \(×\) 108 h or 7.6 \(×\) 106 day; (c) Assuming that the reaction is irreversible simplifies the calculation because we do not have to account for any reactant that, having been converted to product, returns to the original state.
Use the PhET Reactions & Rates interactive simulation to simulate a system. On the “Single collision” tab of the simulation applet, enable the “Energy view” by clicking the “+” icon. Select the first \(A+BC\phantom{\rule{0.2em}{0ex}}⟶\phantom{\rule{0.2em}{0ex}}AB+C\) reaction (A is yellow, B is purple, and C is navy blue). Using the “straight shot” default option, try launching the A atom with varying amounts of energy. What changes when the Total Energy line at launch is below the transition state of the Potential Energy line? Why? What happens when it is above the transition state? Why?
Use the PhET Reactions & Rates interactive simulation to simulate a system. On the “Single collision” tab of the simulation applet, enable the “Energy view” by clicking the “+” icon. Select the first \(A+BC\phantom{\rule{0.2em}{0ex}}⟶\phantom{\rule{0.2em}{0ex}}AB+C\) reaction (A is yellow, B is purple, and C is navy blue). Using the “angled shot” option, try launching the A atom with varying angles, but with more Total energy than the transition state. What happens when the A atom hits the BC molecule from different directions? Why?
The A atom has enough energy to react with BC; however, the different angles at which it bounces off of BC without reacting indicate that the orientation of the molecule is an important part of the reaction kinetics and determines whether a reaction will occur.
Glossary
- activated complex
- (also, transition state) unstable combination of reactant species formed during a chemical reaction
- activation energy (Ea)
- minimum energy necessary in order for a reaction to take place
- Arrhenius equation
- mathematical relationship between a reaction’s rate constant, activation energy, and temperature
- collision theory
- model that emphasizes the energy and orientation of molecular collisions to explain and predict reaction kinetics
- frequency factor (A)
- proportionality constant in the Arrhenius equation, related to the relative number of collisions having an orientation capable of leading to product formation
- reaction diagram
- used in chemical kinetics to illustrate various properties of a reaction
