5.3 Compliance and Distortion
At some point the idealization that the output signal is merely the input signal times the gain fails. All amplifiers have a limit on just how large the output signal can be. This is set by the DC power supply and the amplifier design. The maximum output signal (typically, the maximum output voltage) is referred to as the compliance. Any attempt to produce an output signal that swings beyond the compliance will result in waveform distortion. In the simplest case, the output signal is strictly and abruptly limited to the compliance level and any portion of the output waveform that would otherwise lay above that will be removed. It is as if some form of electronic scissors clipped off the top of the waveform. Hence, this is often referred to as clipping. An example of clipping is illustrated in Figure 5.3.1. The ideal output waveform is shown in brown and the clipped waveform is shown in blue. The clipping is so severe here that the clipped waveform now looks less like a sine wave and more like a square wave. This is extreme waveform distortion and has important consequences.
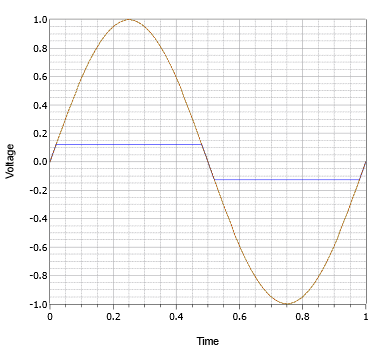
Whenever a signal is altered in the time domain, there will be an alteration of its frequency content. Depending on what we started with and the manner in which the wave shape is altered, new frequency components may be added to the signal and the levels of existing components may be changed or even deleted. The extreme clipping that created a near-square wave added a large number of new frequency components to the signal.
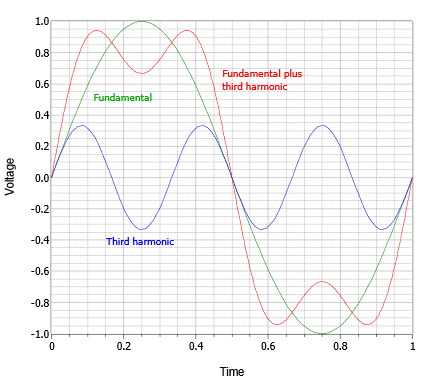
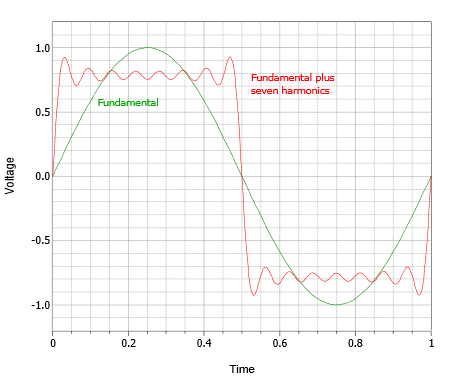
To see how the wave shape and frequency content are connected, consider the waveform depicted in Figure 5.3.2. We start with a simple sine wave shown in green. We refer to this as the fundamental or base frequency. We then add a harmonic. A harmonic is another sine wave that is an integer multiple of the fundamental frequency. It may be larger or smaller in amplitude and the phase may be shifted. In this example we have a single sine at three times the fundamental frequency (blue). When we add this harmonic to the fundamental we arrive at a new waveform shown in red. This new waveform looks something like a square wave but with a “lumpy” top and bottom. If we add more harmonics, these variations will begin to smooth out, as shown in Figure 5.3.3. This waveform appears to be fairly close to a square wave and not too distant from our earlier clipped waveform. Based on this, we can conclude that the clipped sine wave has new frequency components added to it. We can also conclude that if our amplifier clips a more complicated waveform such as a snippet of music, that process will add new harmonics as well. Further, it is likely that these harmonics will be audible and can change our perception of the music, perhaps subtly but maybe drastically.
Along with clipping, amplifiers can exhibit more subtle forms of distortion due to internal nonlinearity. For example, it is possible for the gain to vary slightly as the signal swings from low to high or from negative to positive. An example is shown in Figure 5.3.4 with the distorted wave shown in red.
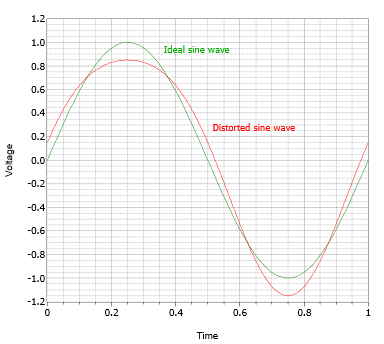
At first glance it may appear as though the wave is merely offset negatively. This is not the case. If we shift the wave vertically, as in Figure 5.3.5, it becomes apparent that the wave is truly distorted and is no longer a pure sine wave.
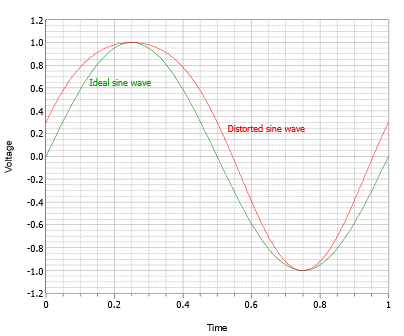
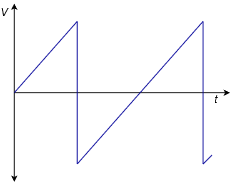
Unlike the clipped wave, the distorted wave in Figure 5.3.5 exhibits an asymmetry; the negative portion does not appear to be a mirror image of the positive portion. In other words, this wave lacks half-wave symmetry. Waves that exhibit half-wave symmetry contain only odd harmonic distortion (harmonics that are odd integer multiples of the fundamental). In contrast, waves that lack half-symmetry have at least one even harmonic. Here is how to test for half-wave symmetry. First, consider the sawtooth wave shown in Figure 5.3.6.
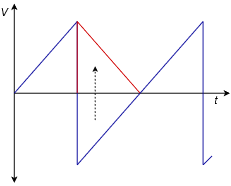
Rotate the negative portion of the wave around the time axis as shown in Figure 5.3.7.
Finally, slide the negative portion over the positive portion and see if they’re identical, as in Figure 5.3.8.
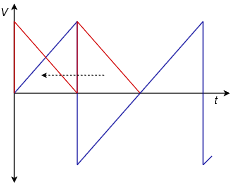
If the two halves are identical then the wave has half-wave symmetry. The sawtooth wave does not exhibit half-wave symmetry, therefore it must contain at least one even harmonic.
An amplifier’s linearity is often quantified through a Total Harmonic Distortion, or THD, measurement. The measurement is carried out by applying a very pure, low distortion sine wave to the amplifier. This is the fundamental. At the output of the amplifier, a very selective filter is used to remove the fundamental. This leaves behind just the added distortion harmonics.[1] These harmonics are then treated as a lumped value and presented as a percentage of the total signal. On an oscilloscope, it is relatively easy for a person to discern THD levels in the double digits. On the other hand, it is very difficult, if not impossible, for an individual to discern THD levels much below 1% by eye. Of course, what matters is what we can hear, not how the waveform looks. To put this in perspective, many high fidelity audio amplifiers exhibit THD levels below 0.1% while an over-driven guitar amplifier might be running over 20%. THD is not the final word on distortion though. It has its limits. For example, all of the distortion products are lumped together. It says nothing about which harmonics are particularly strong or their distribution. It also doesn’t say much about what happens when multiple frequencies interact. One method of trying to quantify that is to apply two sine waves at different frequencies to the amplifier simultaneously. The result is called an Intermodulation Distortion rating, or IMD. This is also expressed as a percentage.
- To be strictly accurate, the residual consists of the harmonics plus any noise produced by the amplifier. Therefore it is more accurate to refer to this as a THD+noise spec. ↵

