16.3 Resolution and Sampling Rate
Perhaps the most obvious source of error is the finite measurement accuracy of the individual signal levels. The major problem here is one of resolution. Resolution represents the finest discernible change in the signal and is often specified in terms of a number of bits, although a voltage specification is also possible. Because the signal level is represented with a binary number, it follows that a large number of bits are needed in order to achieve fine resolution. For example, if an eight-bit word is used, there will be 256 distinct values available. If the maximum peak-to-peak value of the input signal is 1 V, it works out that each step in the word represents about 3.9 mV (1 V/256). Under these conditions, it would be impossible to perfectly encode a value of 14 mV. The nearest values available would be binary 11, which yields 11.7 mV (3 times 3.9 mV), and binary 100, which yields 15.6 mV (4 times 3.9 mV). Obviously, the resulting round-off creates some error in the digital representation. This error can be reduced by increasing resolution so that finer steps may be detected. If 16 bits are used for the same 1 V range, a total of 65,536 values are available, with each step working out to 15.26 𝜇 V. Now, although we still may not be able to exactly represent the 14 mV level, we are guaranteed to be within ± 7.63 𝜇 V, instead of ± 1.95 mV as in the eight-bit case. Because the round-off errors tend to be random in magnitude and polarity, this effect may be viewed as a noise source. In other words, lower resolutions (i.e., fewer bits) produce noisier signals. The number of bits required for a particular application may vary from fewer than 6 for high speed video applications to more than 20 for high quality audio or measurement purposes.
It is important to note that once the size of the digital word is chosen and the peak amplitude fixed, the input signal must stay within specific bounds or gross distortion will occur. For example, if a peak input of 1 V produces the maximum numeric value, there is no way that the digital word can represent a level greater than 1 V. Likewise, if the step size is set at 1 mV, any signals less than 1 mV are lost. Also, low-level signals will suffer from reduced resolution. For best results, the signal peak should produce the maximum numeric value. If the peak is significantly less, the result is akin to using fewer bits in the representation. Finally, even if the resolution is adequate, the absolute accuracy of the conversion must be considered, as it is in any measurement device.
Examples
A certain system uses a 12-bit word to represent the input signal. If the maximum peak-to-peak signal is set for 2 V, determine the resolution of the system and its dynamic range.A 12-bit word means that 212 , or 4096, levels are possible. As these levels are equally spaced across the 2 V range, each step is
![]()
![]()
Therefore, the system can resolve changes as small as 488 𝜇 V.
Dynamic range represents the ratio of the largest value possible to the smallest.
![]()
![]()
![]()
![]()
In the preceding problem, note that the voltage range affects the step size, but does not affect the bit resolution. The actual number of discrete steps that may be resolved is set by the number of bits available. You may notice that each additional bit adds approximately 6 dB of range (a doubling of voltage). Consequently, the dynamic range calculation may be streamlined to
![]()
(12.3.1)
Example 12.3.2
Audio compact disks use a 16-bit representation of the music signal. Determine the dynamic range. Also, if the maximum output level is 0.775 V peak, determine the step size.
![]()
![]()
![]()
For 16 bits, the total number of steps is 216 , or 65536. Assuming that the signal is bipolar, the total signal range will be from −0.775 V to +0.775 V, or 1.55 V.
![]()
![]()
At this point, we must consider the effect of sampling rate on the quality of the signal. It should be intuitively obvious that higher sampling rates afford greater overall conversion accuracy. Of course, there is a trade-off associated with high sampling rates, and that is the accompanying high data rate. In other words, greater resources will be required to store and process the larger volume of digital information. The real question is, just how fast does the sampling rate need to be, for optimum efficiency? The Nyquist-Shannon sampling theorem states that at least two samples are needed per cycle for proper signal conversion. If the signal is not a sinusoid, then at least two samples are required per cycle of the highest frequency component. For example, if a range of signals up to 10 kHz needs to be digitized, then a sample rate of at least 20 kHz is required. Normally, a certain amount of “breathing room” is added to this figure. Another way of looking at this relationship is to state that the highest input-frequency component can be no more than one-half of the sampling rate. Because this is such an important parameter, the value of onehalf of the sampling rate is given the name Nyquist frequency.
![]()
(12.3.2)
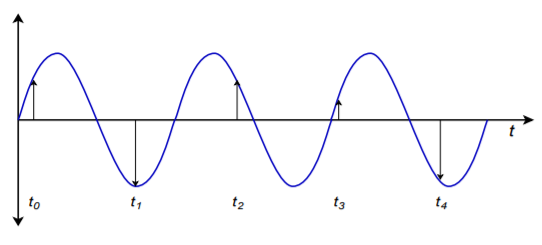
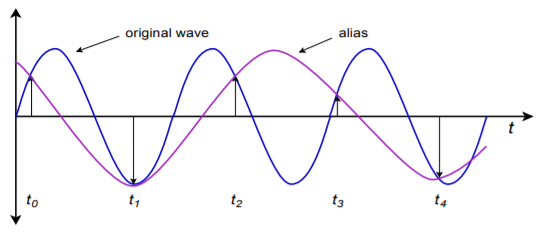
If an input frequency component is greater than the Nyquist frequency, a unique form of distortion called alias distortion, is produced. The resulting distortion product, called an alias, is a new signal at a frequency that is equal to the difference between the input and Nyquist frequencies. Normally, this new signal is not harmonically related to the input signal, and thus, is easily detected. The aliasing effect is shown graphically in Figure 12.3.1 .

Here we see a sampling rate that is only about 1.5 times the input frequency, rather than the required factor of 2 times minimum. In Figure 12.3.2 the sample points are redrawn and connected as simply as possible. Note that the resulting outline is that of a lower-frequency wave. What we notice here is that the data points produced in Figure 12.3.1 are identical to the points produced by a lower-frequency input wave. When these data points are converted back to analog form, the DA converter will produce this lower frequency wave. Oddly enough, the original waveform has completely disappeared; hence the term alias. Any signal component that is greater than the Nyquist frequency will produce aliases.

When considering the possibility of alias distortion, it is worth repeating that the components of the signal must be investigated, not just the base frequency. For example, a 1 kHz square wave has a 1 kHz fundamental and an infinite series of odd-numbered harmonics (3 kHz, 5 kHz, 7 kHz, 9 kHz, etc.). If a 12 kHz sampling rate is used to digitize this signal, a fair amount of alias distortion will be seen. In this example, the Nyquist rate is 6 kHz. All of the harmonics above 6 kHz will produce an alias. In order to prevent this, the input signal must be frequency-band limited. That is, a low-pass filter must be used to attenuate all components above the Nyquist frequency before AD conversion takes place. The amount of filtering required depends on the resolution of the conversion and the relative strength of the above-band signals. Because filters cannot roll off infinitely fast, as noted in Chapter Eleven, sampling rates are normally set more than twice as high as the highest needed input component. In this way, the Nyquist frequency will be somewhat greater than the maximum desired input frequency. The low-pass filter (often referred to as an anti-alias filter) will use this frequency range as its transition band. Even though the attenuation in the transition band is less than optimum, alias distortion will not be a problem. This is shown graphically in Figure 12.3.3 . As you can see, high-roll-off rate filters are desirable in order to attenuate the out-of-band signals as quickly as possible. Very fast filter roll off rates mean that the sampling frequency need only be as little as 10% greater than the theoretical minimum in order to maintain sufficient alias rejection.

Example 12.3.3
Suppose that you need to digitize telephone signals. Assuming that you would like to maintain a dynamic range of at least 50 dB, with an upper frequency limit of 3 kHz, determine the minimum acceptable sampling rate and number of bits of required. The minimum Nyquist rate is equal to the highest desired input frequency. In this case, that’s 3 kHz. Because the sampling rate is twice the Nyquist frequency, the sampling rate must be at least 6 kHz. In reality, if input components above 3 kHz exist, an anti-alias filter will be needed, and the sampling rate will have to be increased somewhat. Because dynamic range is set by the number of bits used, we find that
![]()
![]()
![]()
Because we cannot have a fractional bit, the value is rounded up. The final system specification is a minimum rate of 6 kHz with a 9-bit resolution. Note that this represents a data rate of 9 bits per sample times 6000 samples per second, or 54000 bits per second (6750 bytes per second).

