
1.3 JFET Data Sheet Interpretation
A data sheet for the J111 series N-channel JFET is shown in Figure 1.3.1. This is a small signal device designed for audio frequency circuits. It is available in the common TO-92 through-hole package as well as in the surface mount SOT-23 package. Note that the source and drain are interchangeable for this device.

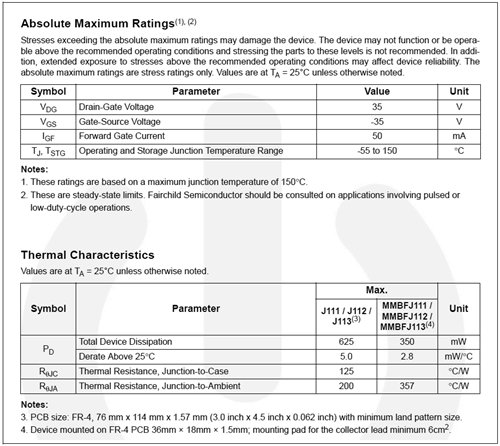
Examining the absolute maximum ratings and thermal characteristics, we find values typical of small signal devices. Maximum drain-gate and gate-source voltages are 35 volts and the maximum power dissipation is 625 milliwatts.
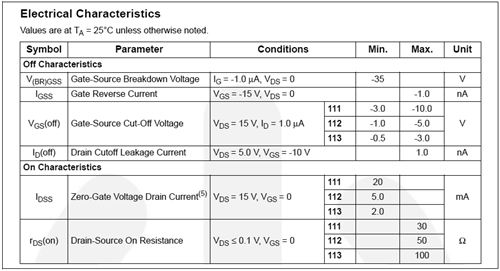
From the electrical characteristics, note the large variation in 𝑉𝐺𝑆(𝑜𝑓𝑓). For the J111, this runs from a minimum of −3 V to a maximum of −10 V. The J112 and J113 exhibit even wider min/max ratios. Also, note how the larger 𝑉𝐺𝑆(𝑜𝑓𝑓) ranges are associated with larger maximums for 𝐼𝐷𝑆𝑆. Finally, let’s take a look at a series of performance curves shown in Figure 1.3.1𝑑.
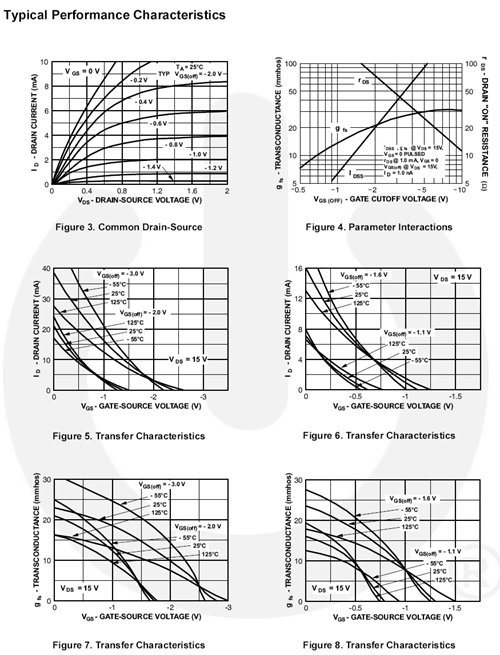
The upper-left graph is a family of drain curves and corresponds to Figure 1.2.3, presented earlier. Note that the horizontal scale for 𝑉𝐷𝑆 only shows the first 2 volts. The point here is to examine the ohmic region. The two middle graphs plot the characteristic curve of the device and correspond to Figure 1.2.4, although these graphs are drawn rotated around the vertical axis (note that 𝑉𝐺𝑆 is still shown as a negative value). Two important things may be noted here. First, as already mentioned, large values of 𝐼𝐷𝑆𝑆 tend to be associated with large values of 𝑉𝐺𝑆(𝑜𝑓𝑓). This graph shows that individual plots tend to scale both horizontally and vertically away from the origin. Second, thermal variations are very much apparent: As the temperature increases, the characteristic curve tends to become less steep.
Finally, the two bottom-most graphs plot the variation of 𝑔𝑚 with 𝑉𝐺𝑆. These correspond to Figure 1.2.5, although again, the horizontal axis has been rotated around the vertical. Once again we see considerable variation due to temperature. Also, none of the plots exhibit perfect linearity. Further, at lower temperatures, the linearity of the plots decreases even more, warping a relatively straight line into a complex curve.
